INFS3703 Information Systems Project Management — Complete Study Guide, Weeks 1–8
Course: INFS3703 Information Systems Project Management, UNSW, Term 2 2026
Scope of this guide: Weeks 1–8 (Week 6 was a non-teaching Flex Week — see its section)
Built from: the course folder only (seminar decks, weekly dossiers, assessment guides, seminar transcripts, and the student's own pre-work artefacts). No external sources were used.
Companion file: Course_Weeks_1-8_Source_Map.md (claim-by-claim source table)
1. Course overview
INFS3703 teaches how Information Technology (IT) projects are managed professionally. The course is explicitly aligned to the PMI (Project Management Institute) and its PMBOK (Project Management Body of Knowledge), which "forms the basis of this course" (Wk01 Seminar, slide 5). As a level-3 course it aims at the upper levels of Bloom's Taxonomy — Applying, Analysing, Evaluating, Creating — meaning you are marked on applying and justifying project-management tools, not reciting definitions (Wk01 Seminar, slide 6; reinforced verbally in the Week 4 seminar).
Seminars are run by an industry-practitioner teaching team: Xavier Jusay (EY, Lecturer-in-Charge, Thursday stream), Donia Saeidi (Westpac, Monday stream), and Chona Ryan (UNSW, Academic-in-Charge), with co-facilitators from Accenture, CommBank, UNSW and Suncorp (Wk01 Seminar, slide 4).
The 10-week roadmap (official — Wk01 Seminar, slide 8; repeated at the front of every weekly deck)
| Week | Seminar topic |
|---|---|
| 1 | Introduction to Information PM |
| 2 | Managing People (stakeholders, teams, communication) |
| 3 | Process Groups & Methodologies |
| 4 | Scope Management |
| 5 | Schedule Management |
| 6 | Flex Week — no seminar, no pre-work, no exam |
| 7 | Cost & Quality Management |
| 8 | Risk Management |
| 9 | Project Integration, the Organisational Environment & Strategic Context |
| 10 | Team Project Presentations |
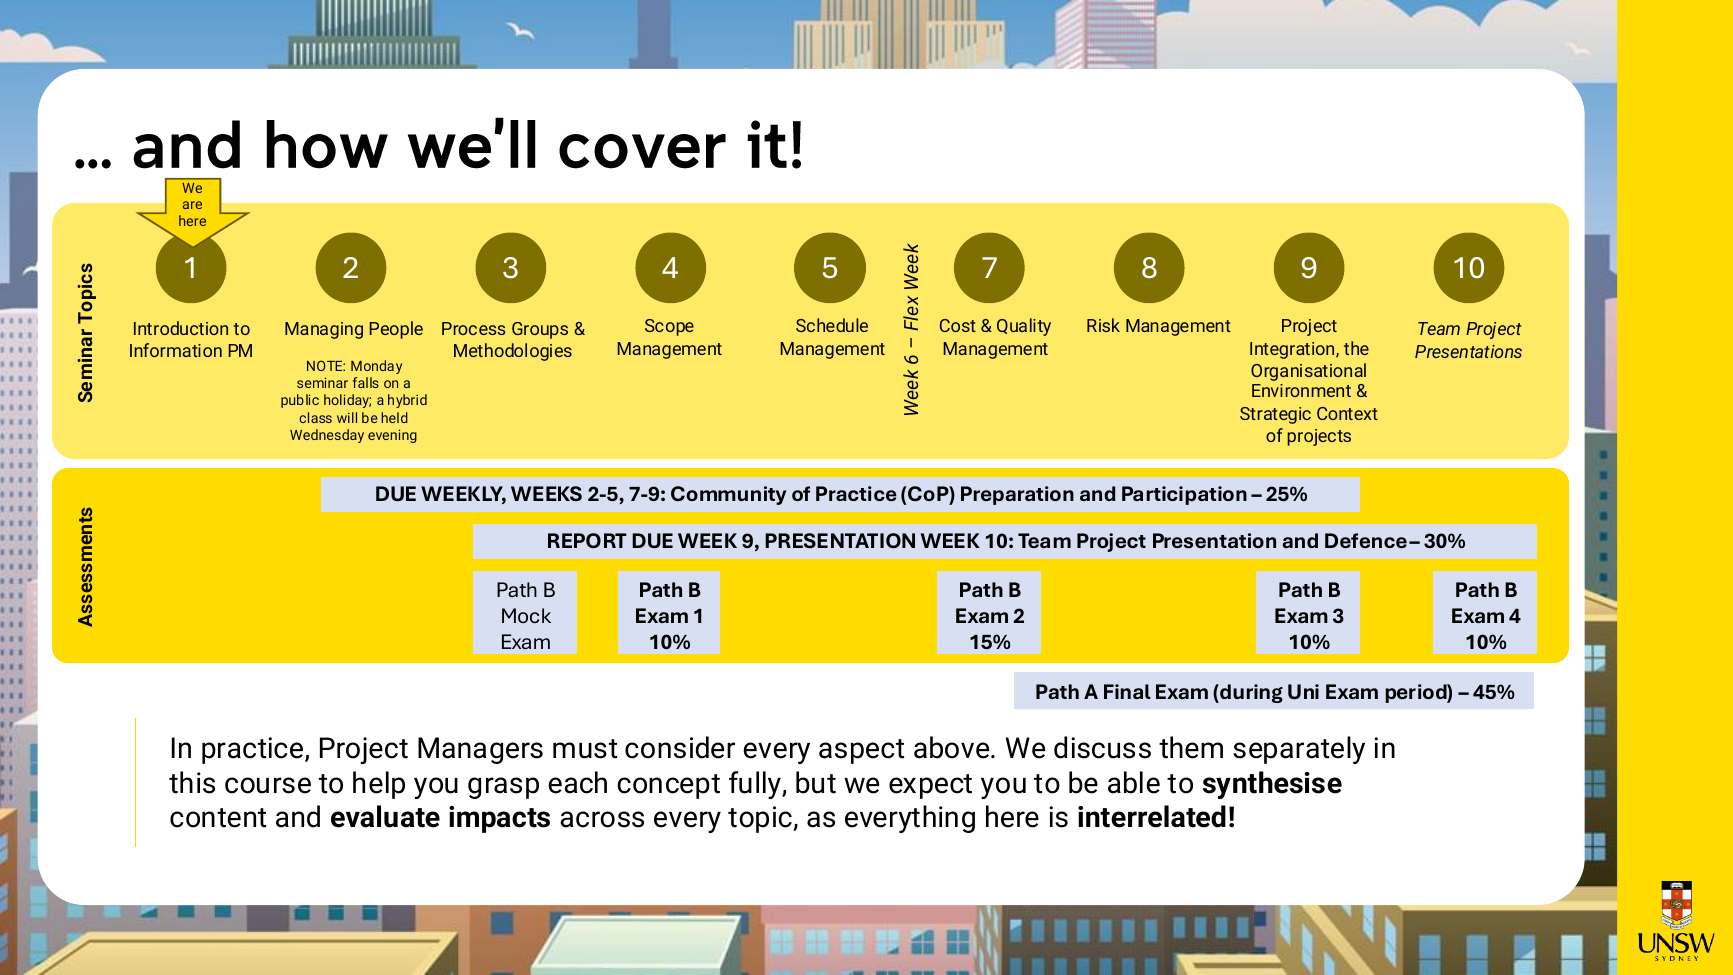
WEEK1/INFS3703 Wk01 Seminar.pdf, slide 8.The roadmap slide carries a note that matters for exams: topics are taught separately, but "we expect you to be able to synthesise content and evaluate impacts across every topic, as everything here is interrelated" (Wk01 Seminar, slide 8).
The three assessments
- Community of Practice Contribution (CoPC) — 25%. Weekly, Weeks 2–5 and 7–9 inclusive: 3.5% per week for Weeks 2–5 and 7–8, plus 4% for Week 9. Each weekly mark is 50% Preparation (the "Weekly Artefact Portfolio" — pre-work applying PM tools to the Project Pulse case) and 50% Participation in the face-to-face seminar. Pre-work is due by 9 pm the night before your enrolled seminar. Arriving more than 10 minutes late (or after Path B exams conclude) counts as absent (mark of 0 pending special consideration). (CoPC Assessment Guide, pp. 1–5.)
- Note on the submission channel: the CoPC guide says upload to the Teams Class Notebook, but in the Week 4 seminar the coordinator announced submissions had moved to Moodle ("No more class notebook… It's all Moodle"), keeping the 9 pm deadline. The guide was evidently not updated. (Conflict: official guide vs Week 4 transcript.)
- Team Project — 30%. Groups of 4–5 (formed in Week 1; "NO groups of 3 or 6!"), based on the separate Project Atlas case (an AI-agent project in trouble at OmniRetail Group). Components: Project Recovery Plan content 7.5% (cover page + title page + max 8 slides, due Wed 29 July 2026, 9 pm AEST, Week 9), presentation delivery 7.5% (6 minutes, Week 10 seminar), and live Q&A defence 15% (6 minutes, panel plays project stakeholders). GenAI use is limited to "Simple Editing Assistance". (Team Project Assessment Guide, pp. 1–10; Wk01 Seminar, slides 10, 21.)
- Final Exam — 45%, via Path A or Path B. Path A = one traditional exam in the University exam period. Path B = four in-term exams sat at the start of the Week 4, 7, 9 and 10 seminars (Exam 1 10%, Exam 2 15%, Exam 3 10%, Exam 4 10%), with a mock exam trial in Week 3. Students had to lock in a path by the end of Week 3. Strict "NO STUDENT ID, NO EXAM" policy; missing one Path B exam → special consideration and a Week 11 supplementary; missing more than one → automatic default to Path A. (Wk01 Seminar, slides 8, 10, 13. No dedicated Final Exam guide exists in the folder — a "Detailed Final Exam Path Guide" lives on Moodle and could not be inspected.)
The two cases that run through the course
- Project Pulse — the individual case (CoPC pre-work). UNSW wants to improve the on-campus student experience "through technology, sustainability principles and better use of space". You act as part of a project consulting team planning a Smart Campus Pulse System: a mobile-first, accessibility-friendly app to help students navigate campus, see space availability, and reach wellbeing/events/services. It is never built — it must be planned "professionally, credibly, and in a way that could realistically receive funding approval". Each week's dossier feeds a new artefact, and the dossiers deliberately contain "incomplete and sometimes conflicting information, similar to real projects". (Wk01 Seminar, slides 29–31; CoPC Assessment Guide, p. 3; Week 2 Dossier, p. 1.)
- Project Atlas — the team case (Team Project). A troubled project needing a recovery plan; case study and rubric released around Week 3. (Team Project Assessment Guide; Wk04 seminar transcript.)
The artefact portfolio at a glance (what got built each week)
Stakeholder Register (Wk2) → Business Case + methodology, then Project Charter in class (Wk3) → Scope decisions, Scope Statement, requirements, mini WBS (Wk4) → Full WBS, activity list, network diagram, then Gantt chart in class (Wk5) → Flex Week (Wk6) → Cost estimate + quality definitions (Wk7) → RAID log (Wk8). The official Week 9 dossier later confirms this portfolio arc: "stakeholders, business case, scope, schedule, cost, quality, and risk".
2. How to use this guide
- Each week has the same structure: weekly focus → beginner explanation → terminology & frameworks → examples and visuals → required pre-work → evidence of completed pre-work → key points → sources used.
- Evidence labels. Claims come from four kinds of sources, and this guide keeps them separate:
- [Official] — assessment guides, weekly dossiers, seminar slide decks.
- [Transcript] — spoken lecturer/tutor guidance captured in seminar recordings (Weeks 4, 5, 7, 8 only). Useful for exam hints, but the transcripts are rough auto-transcriptions.
- [Student work] — the pre-work artefacts in this folder. These show what was done; their content (e.g. specific dollar figures) is not official course fact.
- [Guide note] — organisational explanation added by this guide.
- Low-confidence material is flagged inline with ⚠. If something could not be verified from the files, the guide says so rather than guessing.
- Images live in
assets/course_guide/(relative paths, so the guide is portable). Every figure states its source file and slide/page. - For a claim-by-claim audit trail, open
Course_Weeks_1-8_Source_Map.md.
3. Week 1 — Introduction to Information PM
Weekly focus
Half course orientation, half foundations. You learn what a project is, what project management is, the triple constraint, how projects differ from programs and portfolios, the 10 PMBOK knowledge areas (and which course week covers each), what project "success" means, and what a project manager actually does. The seminar closes by introducing the Project Pulse case and assigning the first pre-work (a Stakeholder Register, due before Week 2). Students also formed team-project groups of 4–5. There was no pre-work due for Week 1 itself.
Beginner explanation of the content
What is a project? A project is a temporary endeavour — it has an end — with a specific objective (it creates a product, service or result and finishes once that objective is achieved) and specific resources (a team, a sponsor, money). An IS/IT project is one where most of the effort is IT-related, or where the IT function manages it. Important early distinction: project management is not software development — managing the work is a different discipline from doing the technical build. (Slide 18.)
What is project management? PMBOK's definition: "the application of knowledge, skills, tools and techniques to project activities to meet project requirements". Those requirements boil down to three interacting constraints — the triple constraint:
- Scope — what needs to be done / what can be done;
- Time — how long it can take / when it must be done by;
- Cost — what it will cost / what resources exist.
All three are usually unclear at the start (sorting out scope is typically the first job), and they trade off against each other: change one and the others must change. This idea recurs in every later week. (Slide 19, showing textbook Figure 1-1.)
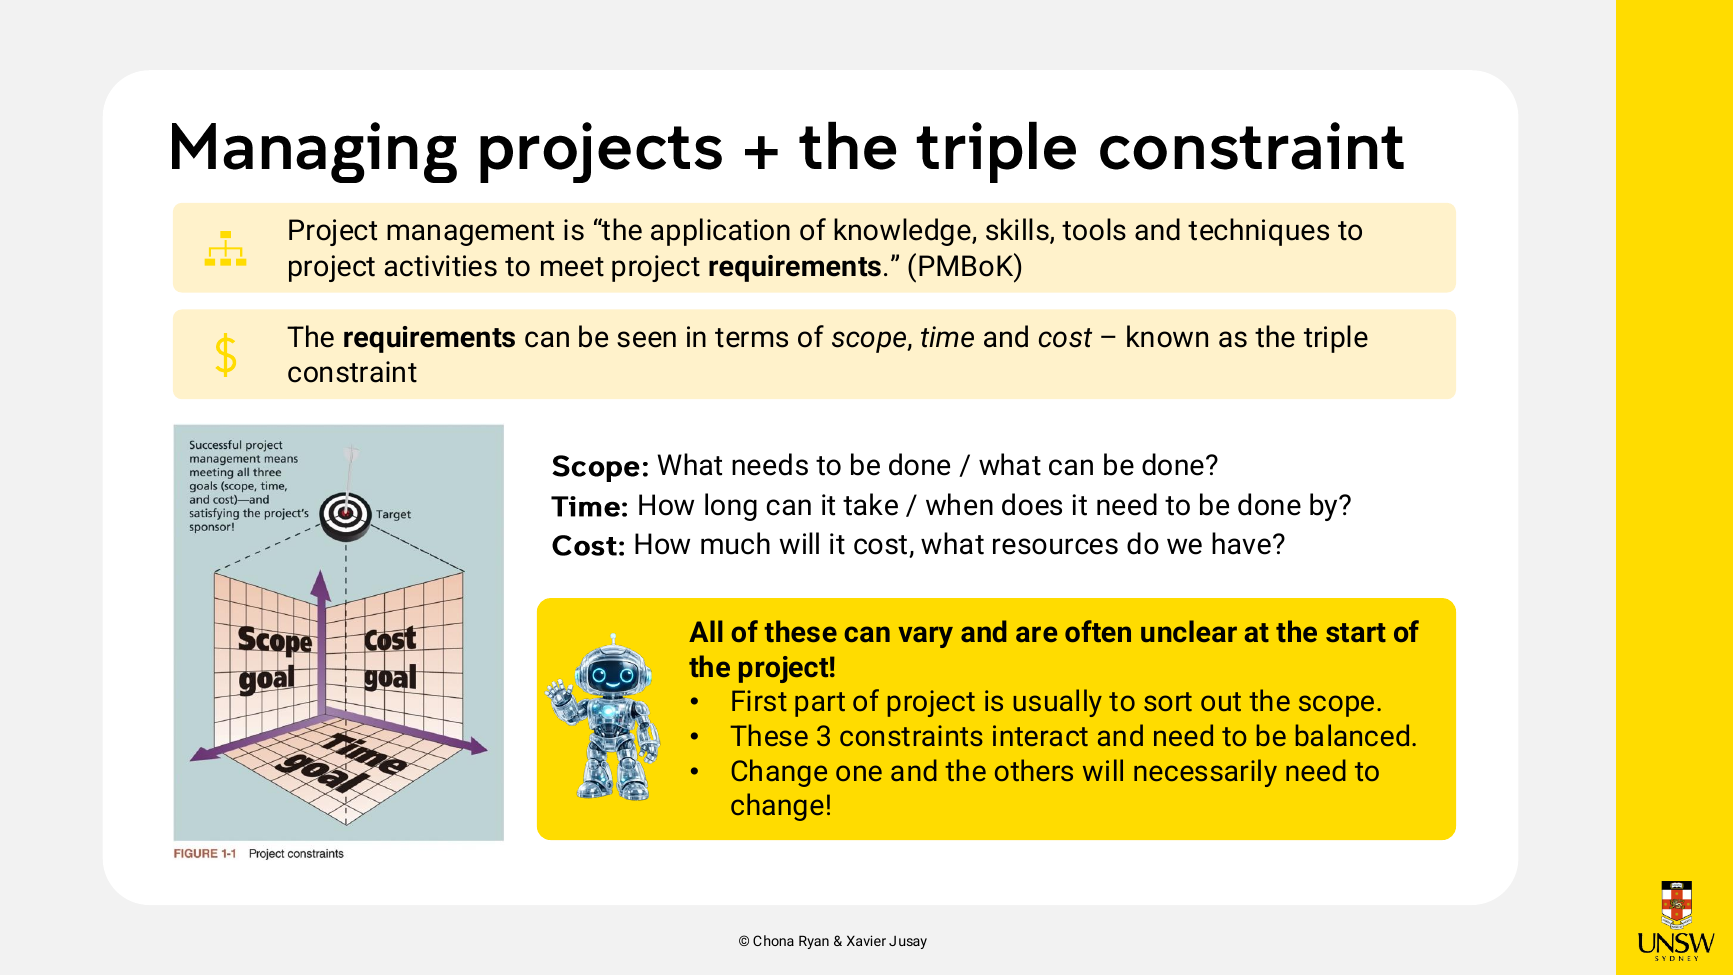
WEEK1/INFS3703 Wk01 Seminar.pdf, slide 19.Projects vs programs vs portfolios. A program is "a group of related projects managed in a coordinated manner to obtain benefits and control not available from managing them individually" (PMBOK 7th ed., 2021). Portfolio management sits above both: choosing the optimum mix of projects and programs given the organisation's funding and resources ("Are we working on the right projects?"). Textbook Figure 1-4 categorises IT investments as Venture (transform the business) / Growth (grow the business) — discretionary spend — versus Core (run the business) — nondiscretionary. A real university technology-portfolio architecture with 14 domains was shown as an example. (Slides 23–24.)
The 10 knowledge areas — the course map. The PM framework (textbook Figure 1-2) shows stakeholder needs feeding ten knowledge areas, applied through tools and techniques, producing project success. Four core areas lead to specific objectives: Scope (Wk4), Schedule/Time (Wk5), Cost (Wk7), Quality (Wk7). Five facilitating areas are the means to those objectives: Human Resources (Wk2), Communication (Wk2), Stakeholder Management (Wk2), Risk (Wk8), Procurement (Wk9). Project Integration Management (Wk9) affects and is affected by all the others. Each area brings tools you will actually build: charters, scope statements and WBS; Gantt charts, network diagrams, critical path; cost estimates and earned value management; risk matrices. (Slides 7, 25.)
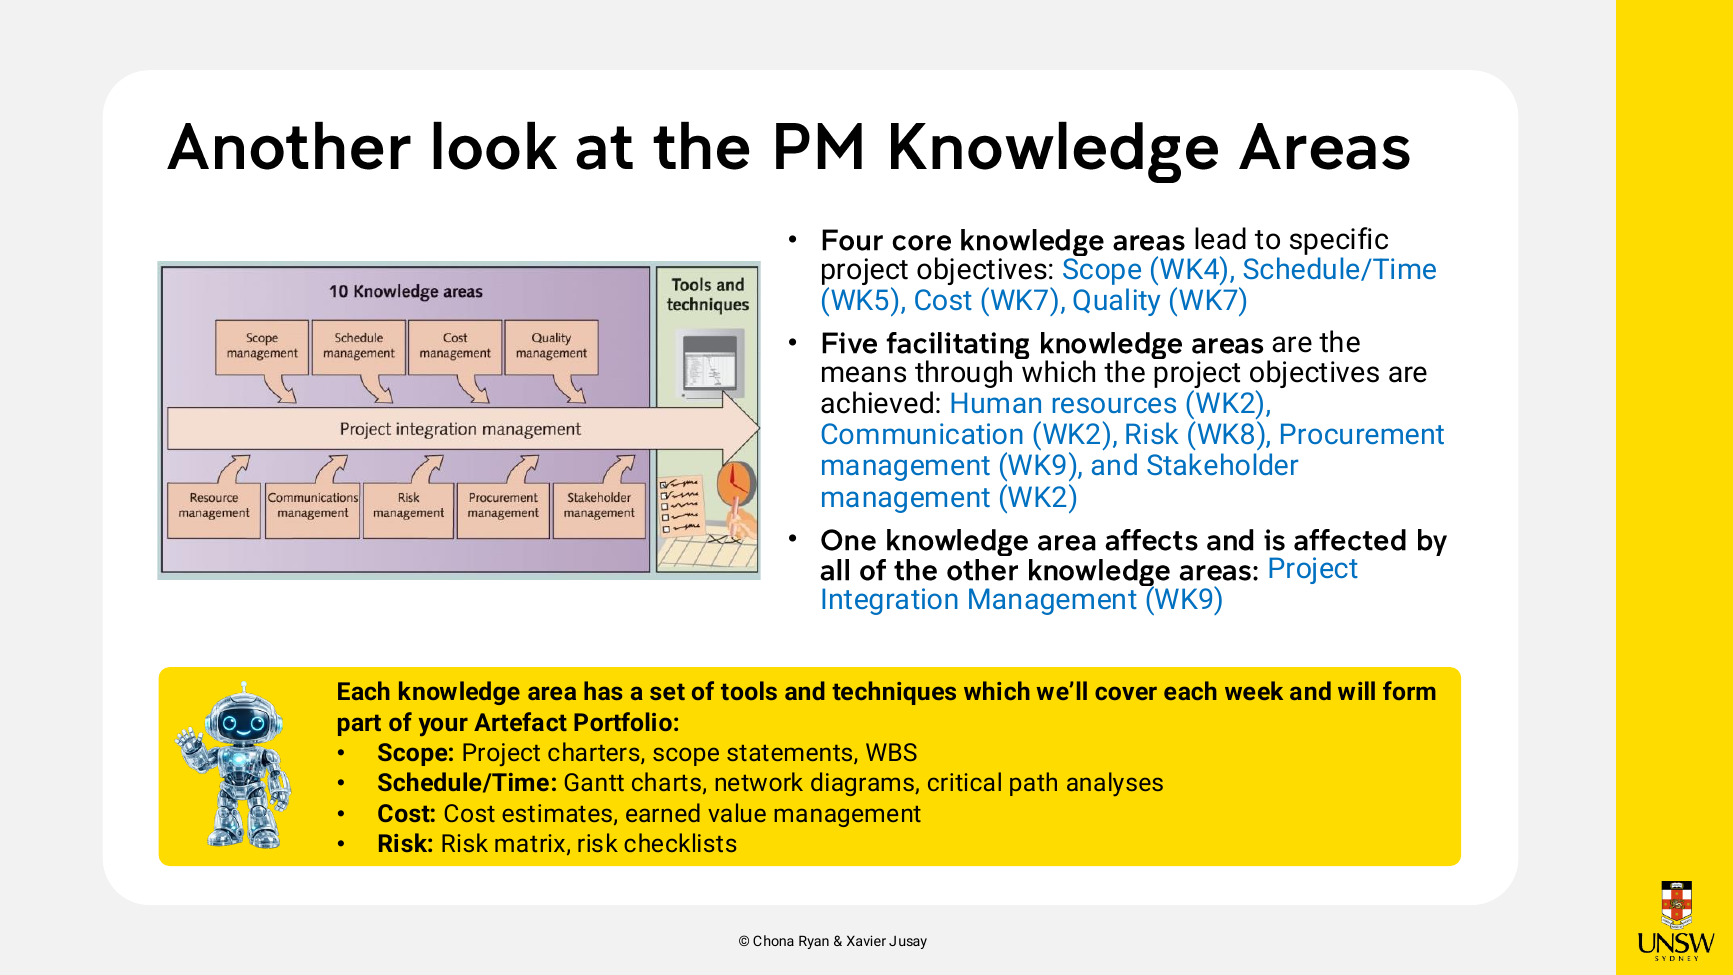
WEEK1/INFS3703 Wk01 Seminar.pdf, slide 25.Project success. The usual test is on time, on budget, delivering the functionality stakeholders wanted — plus sponsor/customer satisfaction and objectives met. But success is contentious: it depends on who you ask, their expectations, the disruption caused, and how much time has passed. Nine contributing success factors: user involvement, executive support, experienced PM, clear business objectives, optimised scope, agile process, skilled resources, execution, tools and infrastructure. (Slide 26.)
The PM's role. The person in charge of the project, working with sponsors, teams and stakeholders; reports to the program manager, sponsor and usually the CIO/CTO. Six traits of highly effective PMs: strategic business partner; encourages and recognises contributions; respects and motivates stakeholders; fully vested in success; integrity and accountability; able to "work in the gray" (deal with ambiguity). (Slide 27.)
Why this matters (industry framing). Worldwide IT spending was projected at $5.06 trillion for 2023; 87.7 million project-management-oriented roles will be needed by 2027; organisations waste $97 million per $1 billion spent on projects (PMI Pulse of the Profession). (Slide 16.)
Important terminology and frameworks
| Term | Meaning (as taught) |
|---|---|
| Project | Temporary endeavour with a specific objective and specific resources (slide 18) |
| IS/IT project | Majority of effort is IT-related, or IT manages it (slide 18) |
| Project management | Application of knowledge, skills, tools and techniques to project activities to meet project requirements (PMBOK; slide 19) |
| Triple constraint | Scope–time–cost; interacting, must be balanced (slide 19) |
| Program | Coordinated group of related projects (PMBOK 7th ed.; slide 23) |
| Portfolio management | Choosing the optimum mix of projects/programs given funding and resources (slide 23) |
| Core vs facilitating knowledge areas | Core: scope, schedule, cost, quality. Facilitating: HR, communication, risk, procurement, stakeholder (slide 25) |
| Project Integration Management | The knowledge area that affects and is affected by all others (slide 25) |
| CoPC | Community of Practice Contribution — the 25% weekly assessment (CoPC Guide) |
| Path A / Path B | The two final-exam routes (slides 8, 10) |
Examples and visual material
- Javier's app-launch activity (slide 21): a team wants to launch an app by end of Week 10; groups picked a scenario (add two features / bring the deadline forward two weeks / cut 10% of cost) and identified which constraints must change, what to push back on, and one new risk — the triple constraint in action.
- Donia's success-perspectives activity (slide 28): a system delivered 3 months late and 15% over budget, but users love it — is it a success? Answer depends on whether you ask the sponsor, end user, PM or CIO.
- Figures 1, 2, 3 above (roadmap, triple constraint, knowledge areas).
Required pre-class preparation
[Official] No CoPC pre-work was due for Week 1 (the CoPC regime runs Weeks 2–5 and 7–9 only). Required reading for the week was textbook Chapter 1 (slide 2). The Week 1 seminar assigned the first pre-work, due before Week 2: read the Week 2 dossier on Moodle and build a Stakeholder Register (any format; a living document) with at least: stakeholder role/title or group; interest/needs; influence/power (and why); likely attitude (supportive/neutral/resistant); key concerns/risks; engagement approach. (Slide 31; CoPC Guide, pp. 1, 3.)
Evidence of completed pre-work
Status: No pre-work requirement identified (for Week 1 itself). The WEEK1 folder contains only the official seminar deck. The Stakeholder Register assigned this week was completed and lives in the WEEK2 folder — it is assessed as Week 2's pre-work and covered in the Week 2 section.
Key points to remember
- Project = temporary + specific objective + specific resources; PM ≠ software development.
- The triple constraint (scope/time/cost) governs everything — change one, the others move. This is the course's most recycled idea.
- Know the 4 core + 5 facilitating + 1 integrating knowledge areas and which week teaches each.
- Project success is contentious — perspective, expectations, disruption, and elapsed time all change the verdict; know the nine success factors.
- Assessment structure: CoPC 25% (weekly), Team Project 30% (report Wk9, defence Wk10), Final Exam 45% (Path A or B; lock in by end of Week 3).
Sources used
WEEK1/INFS3703 Wk01 Seminar.pdf(33 slides; esp. slides 2, 5–10, 13–14, 16–31)assessments/INFS3703 CoPC Assessment Guide.pdf(pp. 1–5)- (No dossier, transcript, or student artefact exists for Week 1; no Week 1 spoken guidance can be evidenced.)
4. Week 2 — Managing People
Weekly focus
Three linked topics: (1) Organisation and culture — the environment a project lives in; (2) the project team — acquiring, building and tracking a team, and how a PM exercises influence; (3) communication and stakeholder management — identifying stakeholders, planning communications, and managing expectations, using the Power/Interest Grid. The first Project Pulse artefact (Stakeholder Register) was due, then refined in class into a register + power-interest matrix + communication plan. Reading: textbook Chapters 9 & 10. (The Monday seminar fell on the King's Birthday public holiday and ran as a hybrid Wednesday-evening class instead.)
Beginner explanation of the content
Understand the organisation before you manage the project. An organisation is simultaneously processes, people with complicated relationships, shared beliefs, assets and history — viewable through four perspectives: structural, political, human resource, symbolic. Structure tells you where authority, money and decisions sit ("who reports to who? who pays for what?"): IT effort can be centralised (teams reporting to a single project management office (PMO), sharing resources) or decentralised (teams doing their own thing); the classic functional / project / matrix organisational structures were shown (Schwalbe Figure 2-3). Culture — "a set of shared assumptions, values and behaviours" — tells you how people behave under pressure, profiled along the Ten Characteristics of Organisational Culture (member identity, group emphasis, people focus, unit integration, control, risk tolerance, reward criteria, conflict tolerance, means-ends orientation, open-systems focus). (Slides 5–10.)
Managing the project team. Three stages: acquire your team (assign vs hire, by skill level, balancing resources), initial team building (communication lines, inclusiveness, celebrating milestones), tracking performance (formal + informal reviews). To get performance, a PM has nine influence bases — Thamhain & Wilemon's "Ways to Have Influence on Projects": authority, assignment, budget, promotion, money, penalty, work challenge, expertise, friendship. The week's takeaway: PMs rarely rely on authority alone — influence comes from credibility, relationships and meaningful work. (Slides 11–15, 27.)
Communication and stakeholder management. Stakeholder management = sharing information, engaging stakeholders, and managing their expectations. Communication does not happen by accident; classic failure modes include burying crucial information, avoiding bad news, over-relying on electronic channels, and forgetting that "what is said is often not what is heard". The topic is organised as five areas: identify stakeholders → plan communications → distribute information → manage expectations/engagement → report performance. Identification uses a stakeholder register with internal/external categorisation. Planning uses the Power/Interest Grid: plot each stakeholder by power (authority) and interest (concern for outcomes) into four strategies — Manage closely (high/high), Keep satisfied (high power, lower interest), Keep informed (lower power, high interest), Monitor (low/low). A communication plan then specifies, per stakeholder, what they receive, in what format, from whom, and when. An expectations management matrix records the sponsor's priority ranking of scope, time and cost — tying stakeholder management back to the triple constraint. Stakeholders are not static: power, interest and expectations shift over time. (Slides 18–25, 27.)
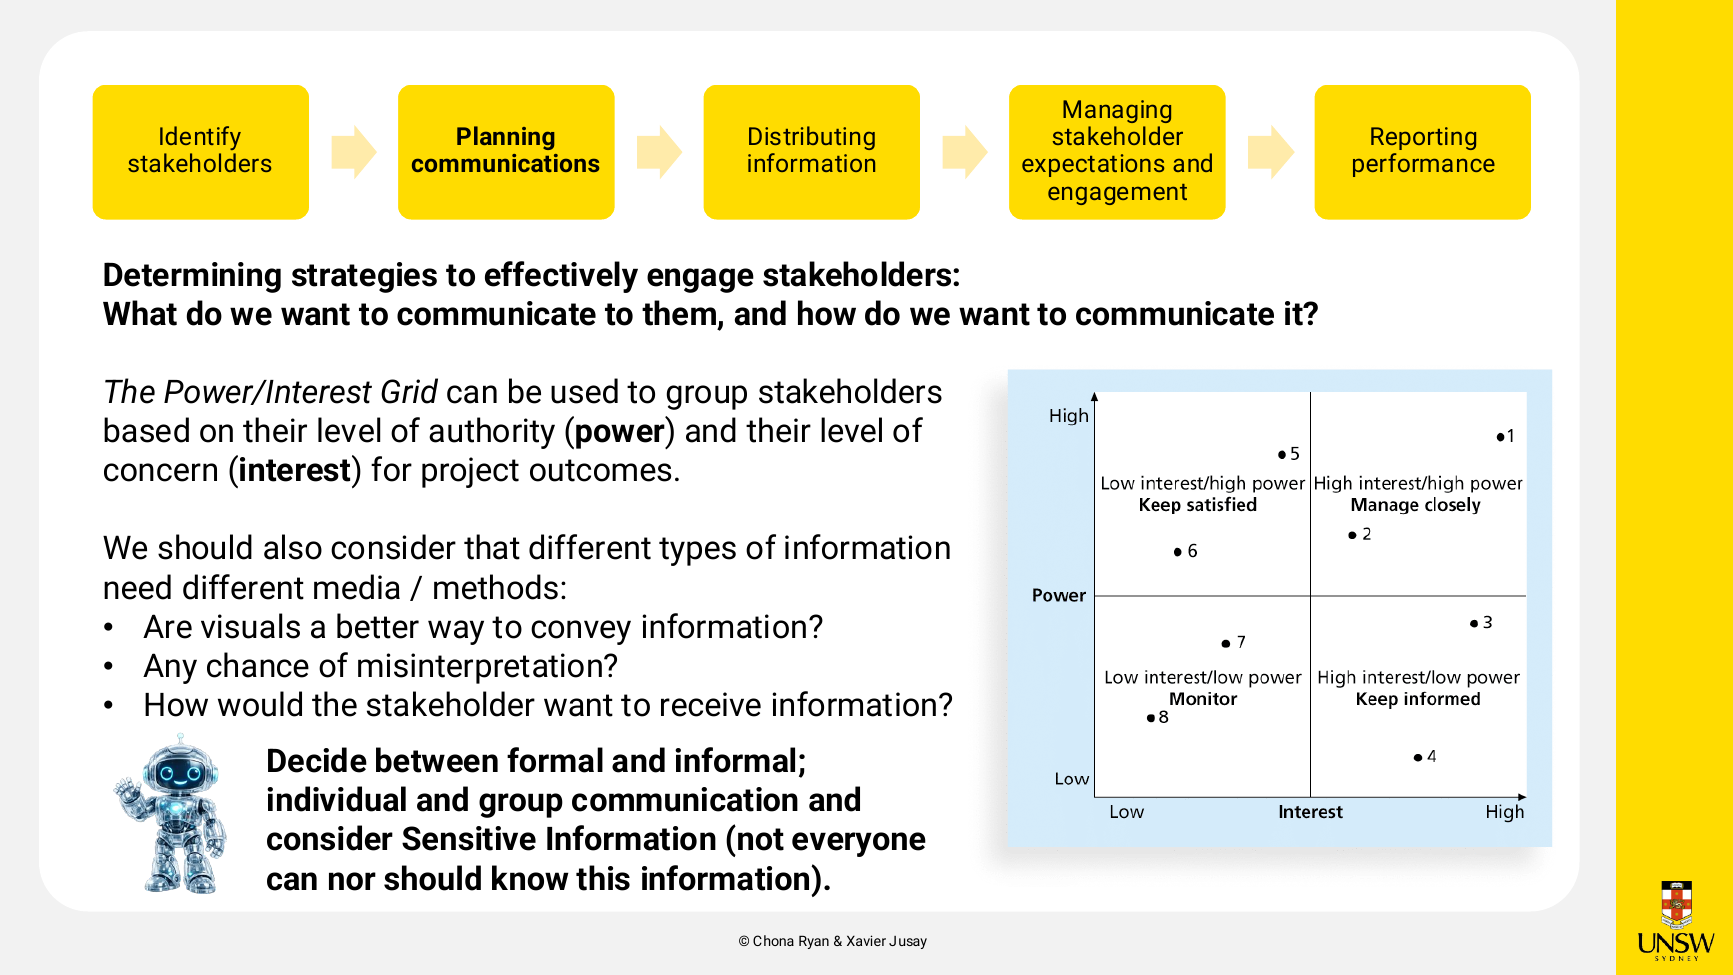
WEEK2/INFS3703 Wk02 Seminar.pdf, slide 21.Important terminology and frameworks
| Term / framework | Meaning (as taught) |
|---|---|
| Organisational culture | Shared assumptions, values and behaviours; ten characteristics (slide 9) |
| Centralised vs decentralised IT | Single PMO/shared resources vs independent teams (slide 8) |
| Functional / project / matrix structures | Schwalbe Figure 2-3 (slide 8) |
| Stakeholder register | Living document listing everyone involved in/affected by the project (slide 20; dossier p. 1 sets 6 minimum fields) |
| Power/Interest Grid | 2×2: manage closely / keep satisfied / keep informed / monitor (slide 21) |
| Communication plan | Who gets what document, in what format, from whom, when (slide 22) |
| Expectations management matrix | Sponsor's ranked scope/time/cost priorities (slide 25) |
| Thamhain & Wilemon's 9 influence bases | Authority, assignment, budget, promotion, money, penalty, work challenge, expertise, friendship (slide 14) |
| Five areas of communication & stakeholder management | Identify → plan → distribute → manage expectations → report performance (slides 19–25) |
Examples and visual material
- Worked communication plan table (slide 22): e.g. "Customer management / Monthly status report / Hard copy and meeting (in-person preferred) / Tina Erndt, Tom Silva / First of month".
- Worked expectations management matrix (slide 25): Scope priority 1, Time priority 1 ("little give in the completion date"), Cost priority 3.
- Role-play (slide 15): re-engage a skilled but disengaged team member using one or two influence bases and justify why they'd work.
- Dossier voices (Week 2 Dossier, Documents 1–10): the sponsor's constraint "This cannot become another app students ignore"; IT's "If this becomes a platform, it needs governance"; a student's "If the app feels like marketing or surveillance, it dies"; Facilities' "We can't become the data entry team for this app".
- Figure 4 above (Power/Interest Grid).
Required pre-class preparation
[Official] Read the Week 2 dossier (10 documents: sponsor brief, meeting minutes, IT integration email, privacy & legal email, student consultation notes, facilities conversation, accessibility feedback, security note, sustainability input, vendor pitch) and build a Stakeholder Register covering, at minimum: role/title or group; interest/needs; influence/power (and why); likely attitude; key concerns/risks; engagement approach. Any format; it is a living document. The dossier warns its information is deliberately incomplete and conflicting — spotting that is part of the assessed skill. Discussion questions to prepare: who may be impacted and how; who is the most important stakeholder right now and why. Individual upload by 9 pm the night before the seminar. (Week 2 Dossier, p. 1; Wk02 Seminar, slide 4; CoPC Guide, pp. 1, 3–4.)
Evidence of completed pre-work
Status: Completed.
Final artefact: WEEK2/final Week 2 pre-work Stakeholder Register for Project Pulse.pdf — a 2-page OneNote Class-Notebook export (section "Community of Practice – Artefact Portfolio").
[Student work] The artefact exceeds the minimum register requirement and contains: a 14-row stakeholder register with all six required fields plus internal/external (e.g. Shona Bryan, Sponsor — HIGH power, supportive, "controls funding pathway… owns the governance deadline"; Pauline Xiao, Privacy & Legal — "privacy non-compliance is a project-stopper"; Students — "LOW formal authority, HIGH adoption power"); five key judgements (adoption risk is the dominant threat; privacy vs personalisation is unresolved; "real-time" accuracy is a credibility risk — redefine as tiered; accessibility is a design principle, not a compliance checkbox; pilot-first rollout is safer); a Power/Interest quadrant view (Manage closely: Sponsor, IT Platforms, Privacy & Legal, Facilities; etc.); and a 6-row communication priorities table. It also identified a gap the dossier left open (no named representative for Wellbeing Services) — exactly the "spot the incomplete information" skill the dossier asks for.
Versions: Wk2_CoPC_Stakeholder_Register_Project_Pulse_v5.html is the source draft (explicitly v5; v1–v4 are not in the folder) with substantively identical content plus a "Refinement Note" that did not survive into the PDF export. The PDF was judged final from its "final" filename prefix, its Class-Notebook section name (matching the CoPC submission location), and content matching the highest-numbered draft. ⚠ The OneNote page header shows a stale "April 18, 2022" timestamp, so file dates cannot sequence these versions; and there is no upload receipt, so actual submission cannot be verified from the folder alone.
Key points to remember
- Understand the organisation first: structure = where authority and money sit; culture = how people behave under pressure.
- Know the Ten Characteristics of Organisational Culture and the four organisational perspectives.
- Team management = acquire → build → track; influence beats authority (know all nine Thamhain & Wilemon bases).
- The five communication/stakeholder areas, and the Power/Interest Grid's four strategies, are the week's core exam material.
- Communication is a planned management tool, not admin; stakeholders (and their grid positions) shift over time.
- The register built this week is a living document — later weeks explicitly reuse and update it.
Sources used
WEEK2/INFS3703 Wk02 Seminar.pdf(28 slides; esp. 3–15, 18–27)WEEK2/Week 2 Dossier.pdf(p. 1 task; pp. 2–11 Documents 1–10)assessments/INFS3703 CoPC Assessment Guide.pdf(pp. 1, 3–5)WEEK2/final Week 2 pre-work Stakeholder Register for Project Pulse.pdf[student final]WEEK2/Wk2_CoPC_Stakeholder_Register_Project_Pulse_v5.html[student draft]- (No Week 2 seminar transcript exists.)
5. Week 3 — Process Groups & Methodologies
Weekly focus
How projects are structured and delivered: the five process groups (initiating, planning, executing, monitoring & control, closing), the two key initiation artefacts (business case and project charter), the project management plan, and delivery methodologies — Waterfall vs Agile (Scrum) and hybrids. Project Pulse advanced to the sponsor's question: "Does the business case still stack up for this project, and if so, what method should we adopt to deliver it?" Pre-work was a draft business case + proposed methodology; the in-class activity produced a Project Charter focused on success criteria. The seminar's first 45 minutes were the Path B Mock Exam, and the Team Project (Assessment 2) was briefed. Reading: Chapters 3 and 4 (pp. 149–176 only).
Beginner explanation of the content
The five process groups. A process is a series of actions directed toward a particular result. Project processes fall into five groups: Initiating (incl. pre-initiation), Planning, Executing, Monitoring & Control, Closing. Caveats stressed on the slide: the groups only loosely track when things happen, they are not strict phases, and they are not mutually exclusive. (Slide 5.)
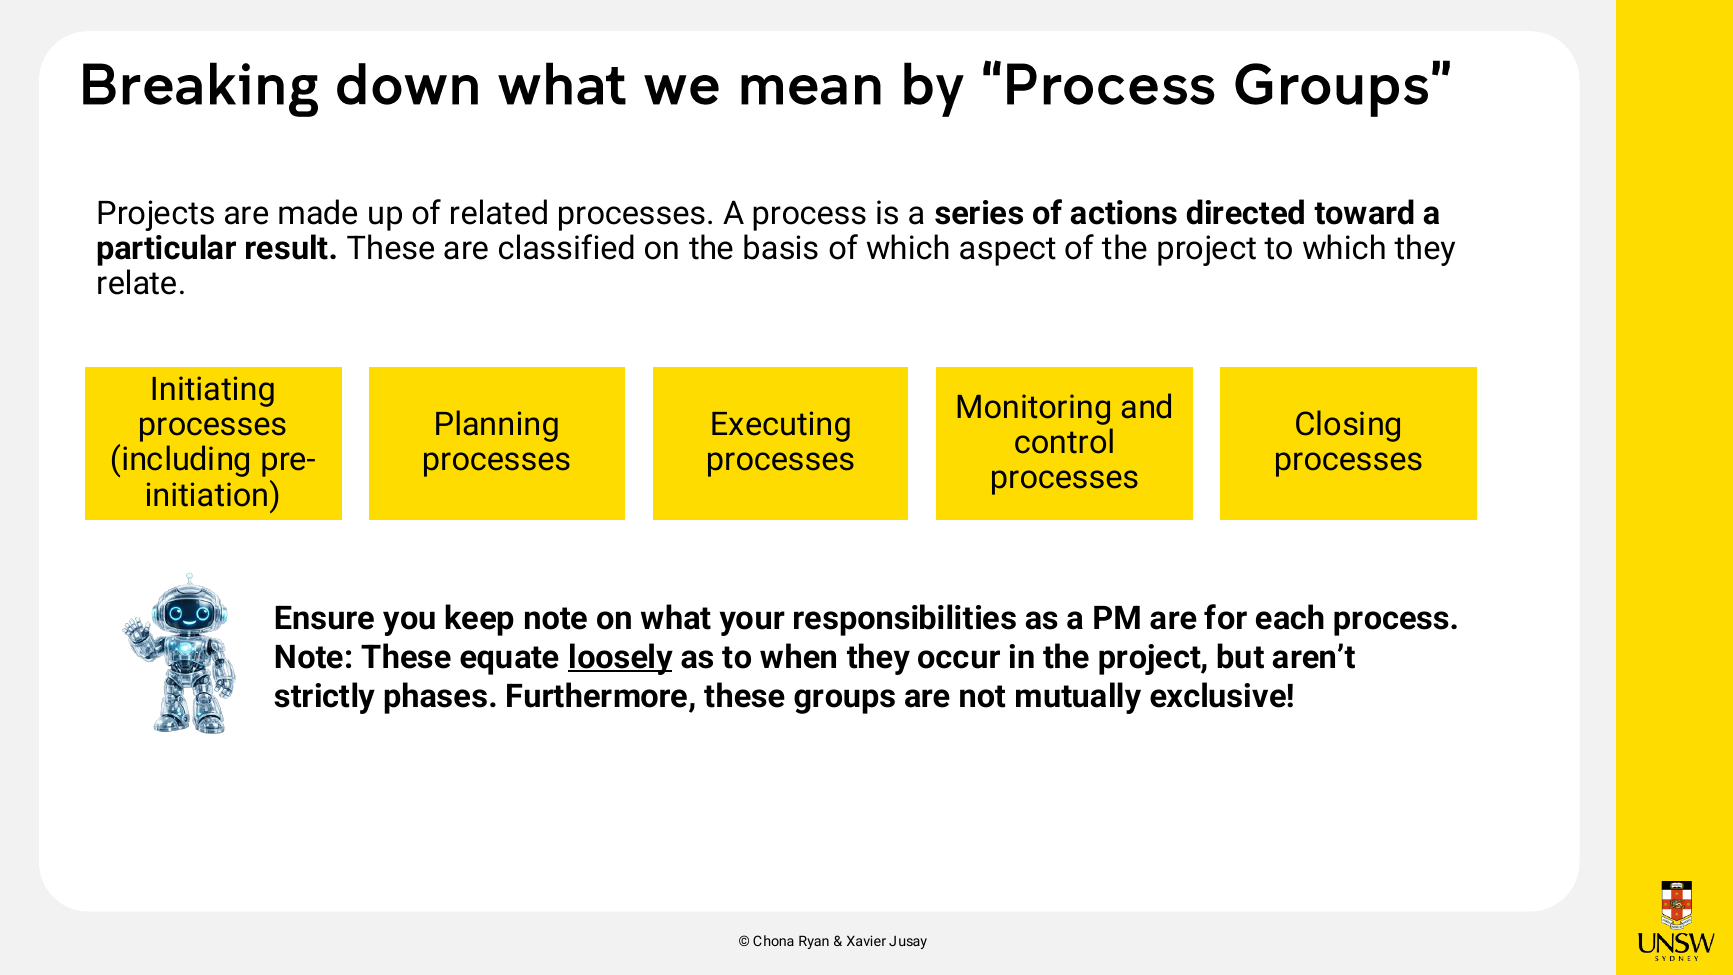
WEEK3/INFS3703 Wk03 Seminar.pdf, slide 5.Initiating: business case, then charter. Which projects get started at all flows from strategic planning (vision, mission, goals). Pre-initiation produces the business case, which "establishes the NEED for the project". Initiation then drafts the project charter, which "formally announces the project to the organisation", followed by a kick-off meeting. Contents to know:
- Business case (slide 8): background; business objective; current situation; assumptions and constraints; options (including "do nothing"); preliminary requirements; initial estimates; preliminary risk analysis. Note: the Week 3 Dossier's pre-work version requires only the first six items (no estimates or risk analysis) and puts the proposed methodology inside "Options" — a documented difference between slide and dossier.
- Project charter (slide 9): title/start date; PM details; objectives; schedule and budget summary; success criteria (the in-class focus); management approach; roles and responsibilities; sign-off.
Planning and the PMP. Every knowledge area includes planning information. Core planning outputs (textbook JWD example): team contract, project scope statement, WBS, Gantt-chart schedule, prioritised risk list — each deep-dived in later weeks. The Project Management Plan coordinates all planning documents and guides execution and control; it starts high-level and gains detail over time. (Slides 11–12.)
Executing, monitoring & control, closing. Executing consumes the most resources and produces the deliverables — plus change requests and document updates. Monitoring & control measures progress against the plan, takes corrective action, and runs across all phases (course tip: your Artefact Portfolio is itself a living deliverable — the stakeholder register may need updating). Closing gains formal acceptance — and even failed projects should be closed to capture lessons learned. Textbook Figure 3-1: "Alpha" PMs spend ~21% of time planning vs 11% for others — more planning pays off in execution. (Slides 13–15.)
Methodologies. A methodology describes how things should be done (processes, steps, templates, reviews, standards). Benefits: structure, guided action, better documentation, quality assurance, continuity — a poor or absent methodology is cited as a key cause of project failure. Costs: overhead; the method can take over the project; it can "bind and blind" the PM. Waterfall = sequential, plan-driven (shown via a real industry Gantt with drafts, reviews, sign-offs). Agile (Scrum) = the product owner keeps a prioritised product backlog; the team plans a sprint backlog; daily Scrums run inside each 2–4-week sprint; each sprint ships a potentially shippable increment reviewed in a sprint review; a sprint retrospective asks what went well and what to change. Each process group has an Agile equivalent (backlogs and velocity instead of detailed plans; burndown charts for monitoring; retrospectives for closing). Hybrid delivery layers predictive governance (stage gates, PMO) over agile delivery streams — "the two worlds can exist side-by-side". (Slides 18–22.)
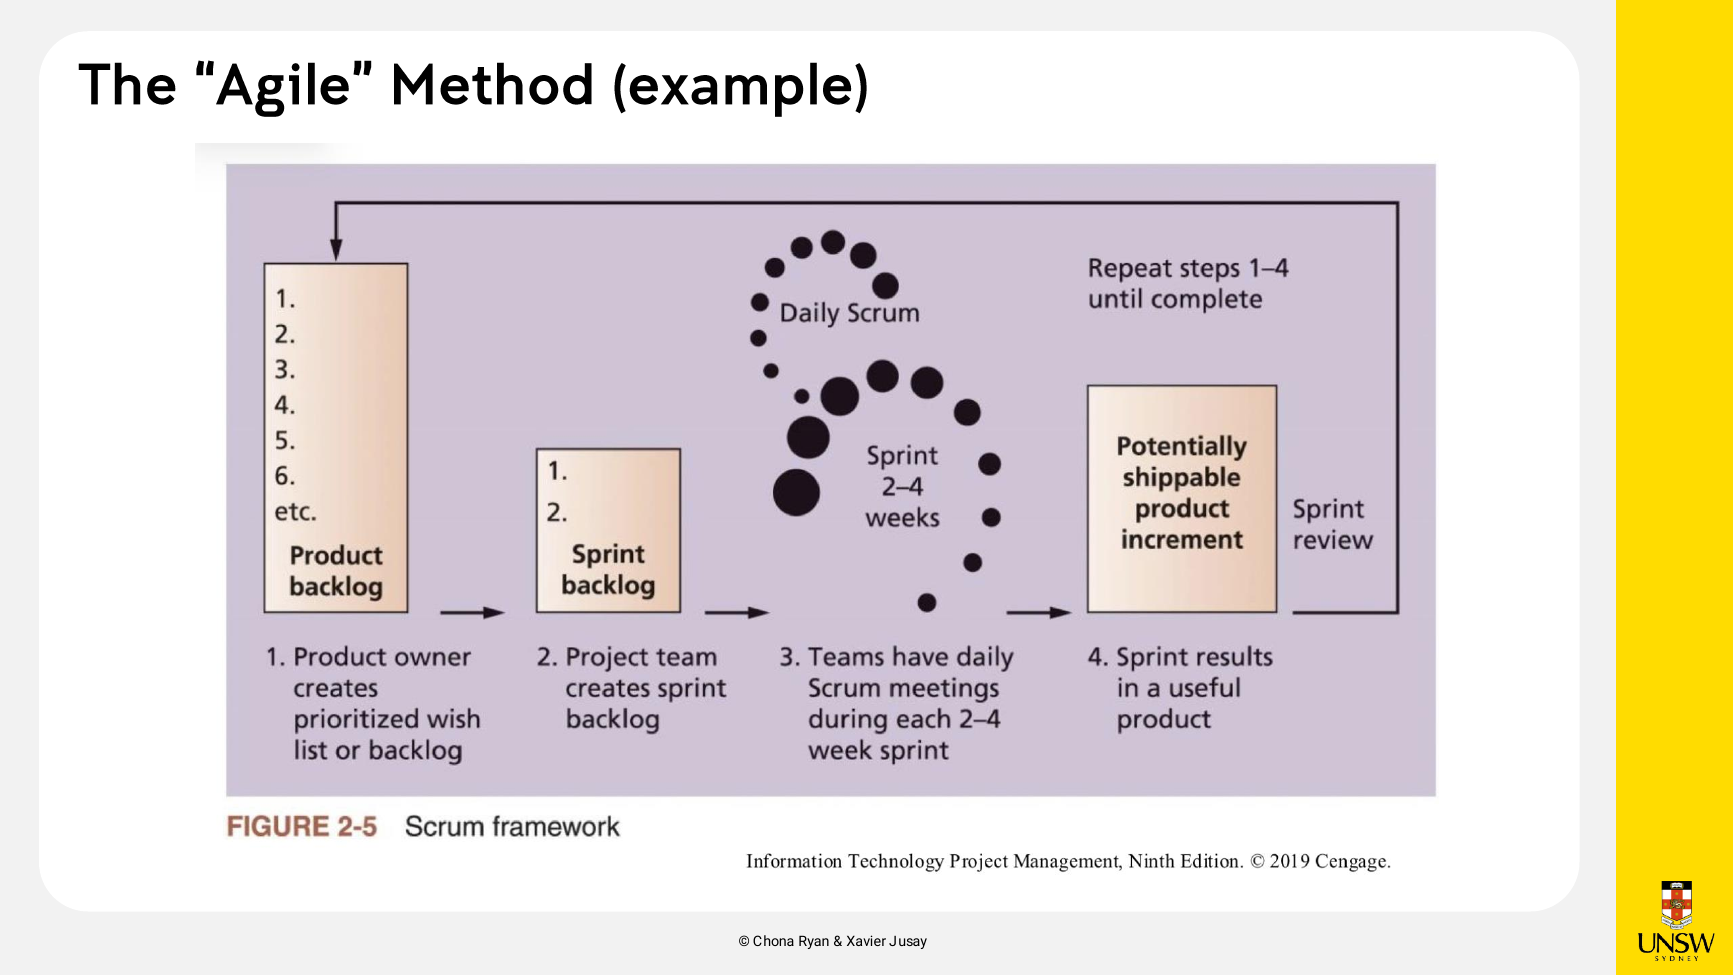
WEEK3/INFS3703 Wk03 Seminar.pdf, slide 20.Important terminology and frameworks
| Term / framework | Meaning (as taught) |
|---|---|
| Process / process groups | Series of actions toward a result; initiating, planning, executing, monitoring & control, closing (slide 5) |
| Business case | Pre-initiation document establishing the NEED (slides 6, 8) |
| Project charter | Formally announces the project; includes success criteria (slides 6, 9) |
| Project Management Plan | Coordinates all planning documents; guides execution and control (slide 12) |
| Methodology | How things should be done: processes, steps, templates, reviews, standards (slide 18) |
| Scrum: product/sprint backlog, velocity, daily Scrum, sprint review, burndown chart, retrospective | The Agile vocabulary set (slides 20–21) |
| Hybrid approach | Most appropriate methodology per program component; predictive + agile side-by-side (slide 22) |
| Figure 3-1 (Alpha PMs) | 21% planning / 69% executing vs 11% / 82% — planning pays off (slide 13) |
Examples and visual material
- JWD Project (textbook): planning outputs = team contract, scope statement, WBS, Gantt, risk list (slide 11).
- Real charter guiding principles (slide 9): "One team; Small measurable wins; Simple and standard; Listen and talk; Schedule is king; Transparent; Prudent."
- Real industry PMP (slide 12): phased plan-on-a-page for a data-migration programme.
- Dossier tension to resolve (Week 3 Dossier, Docs 4–7): "Adoption is the business case"; the vendor pushes rapid rollout ("do not wait for perfect data conditions") while IT warns integration is "doable, but not quick or trivial" and Facilities/Sustainability say "prove it works before scaling it".
- Figures 5, 6 above.
Required pre-class preparation
[Official] Prepare a draft business case for Project Pulse answering the sponsor's question, with reasonable assumptions allowed, containing: background; business objective; current situation; assumptions and constraints; options including your proposed methodology; preliminary requirements. Base it on the dossier's 7 evidence documents (your notes; sponsor email from Shona Bryan; Slack message from student rep Peter Good; "Potential Value Areas" snapshot — "Adoption is the business case"; IT/procurement thread from Sonia Smith; UniversalApps vendor email recommending rapid rollout; Facilities & Sustainability notes — "prove it works before scaling it"). Reading: Ch 3 and Ch 4 pp. 149–176. Individual upload by 9 pm the night before. (Week 3 Dossier, pp. 1–8; Wk03 Seminar, slide 7; CoPC Guide, pp. 1–4.)
Evidence of completed pre-work
Status: Completed.
Final artefacts: WEEK3/Week3_CoPC_Prework_table_colored.html (the pre-work business case) and WEEK3/Loop paragraph.pdf (the follow-on Project Charter from the in-class activity).
[Student work] The business case covers every dossier-required section: project context; background (5 UNSW priorities); a 5-objective table; current situation (quoting "adoption is the business case"); an 8-row assumptions/constraints table (e.g. uneven data quality → a tiered accuracy model); a 3-option analysis — Option 1 do nothing, Option 2 rapid vendor rollout (rejected on privacy/accuracy/procurement risk), Option 3 pilot-first delivery (preferred); a hybrid methodology — "stage-gate control at the project level, combined with iterative, user-tested delivery inside the pilot"; a 12-row preliminary-requirements table; and a conditional recommendation ("the business case… still stacks up, but only conditionally"). Loop paragraph.pdf — despite its unhelpful filename — is a 10-page print of a Microsoft Loop page containing the Project Charter (charter summary table; objectives O1–O5; in/out-of-scope; 5-phase indicative schedule; 10 measurable success criteria SC1–SC10, e.g. ≥30% weekly adoption in pilot buildings, 85% space-data accuracy, WCAG 2.1 AA, 70% satisfaction; hybrid management approach; 10 named roles; 5 preliminary risks; sign-off block). ⚠ Those numeric thresholds are the student's own proposals, not official figures.
Versions: Untitled-2.html (21:30) is a bare unstyled draft; Week3_CoPC_Prework_table_colored.html (21:43, 13 minutes later) is the same text in a finished styled document — final by structure and timestamp. Loop paragraph.pdf was printed 22 June (after the seminar week), so the charter as preserved may include post-class polish. Which file was actually uploaded, and whether the 9 pm deadline was met, cannot be verified from the folder.
Key points to remember
- Five overlapping process groups — not phases, not mutually exclusive.
- Business case = establishes the need (pre-initiation); charter = announces the project (initiation). Know both contents lists — and note the dossier's shorter 6-item business-case list.
- The PMP coordinates all planning documents; planning artefacts (scope statement, WBS, schedule, risk register) each get their own week later.
- Monitoring & control runs across all phases; close even failed projects for lessons learned.
- Methodology: absence is a key failure cause, but it can "bind and blind" — and the in-class challenge is exam-shaped: what risk does your methodology reduce, and what risk does it create?
- Know Scrum end-to-end and how each process group maps into Agile (incl. burndown chart and the two retrospective questions).
- Week 3 was also the assessment fork: Path B mock exam sat, exam path locked in by end of week, Team Project briefed.
Sources used
WEEK3/INFS3703 Wk03 Seminar.pdf(27 slides; esp. 3, 5–15, 18–25)WEEK3/Week 3 Dossier.pdf(final branded version; pp. 1–8) —WEEK3/Week 3 Dossier (Refer Chapters 3 and 4 pp 149-176 of textbook).pdfis an earlier plain export with word-for-word identical contentassessments/INFS3703 CoPC Assessment Guide.pdfWEEK3/Week3_CoPC_Prework_table_colored.html[student final];WEEK3/Untitled-2.html[student draft, identical text];WEEK3/Loop paragraph.pdf[student charter]- (No Week 3 seminar transcript exists, so the mock-exam debrief and Team Project briefing content cannot be recovered.)
6. Week 4 — Scope Management
Weekly focus
Delivering "what you should deliver, no more, no less". The six scope-management processes, requirement types (business/functional/non-functional), the Requirements Traceability Matrix, the Project Scope Statement, the Work Breakdown Structure (WBS) and its five development approaches, scope validation, and scope creep control. Project Pulse: the scope is growing as more stakeholders hear about it — pre-work decides what is in and out of scope for Version 1. This is also the first week with a full seminar transcript in the folder, so the lecturer's marking philosophy and exam hints are documented. Path B students sat Exam 1 at the start of this seminar. Reading: Chapter 5.
Beginner explanation of the content
Scope and why it matters. Scope is all the work involved in creating the project's products (deliverables) and the processes that create them; a deliverable is any product produced as part of the project (software, documents, even meeting minutes). Scope management is defining and controlling what is and is not included. If stakeholders hold different pictures of what is being delivered, dissatisfaction and lost support follow. (Slide 8.)
Six processes structure the week (a chevron repeated on nearly every slide): plan scope management → collect requirements → define scope → create the WBS → validate scope → control scope.
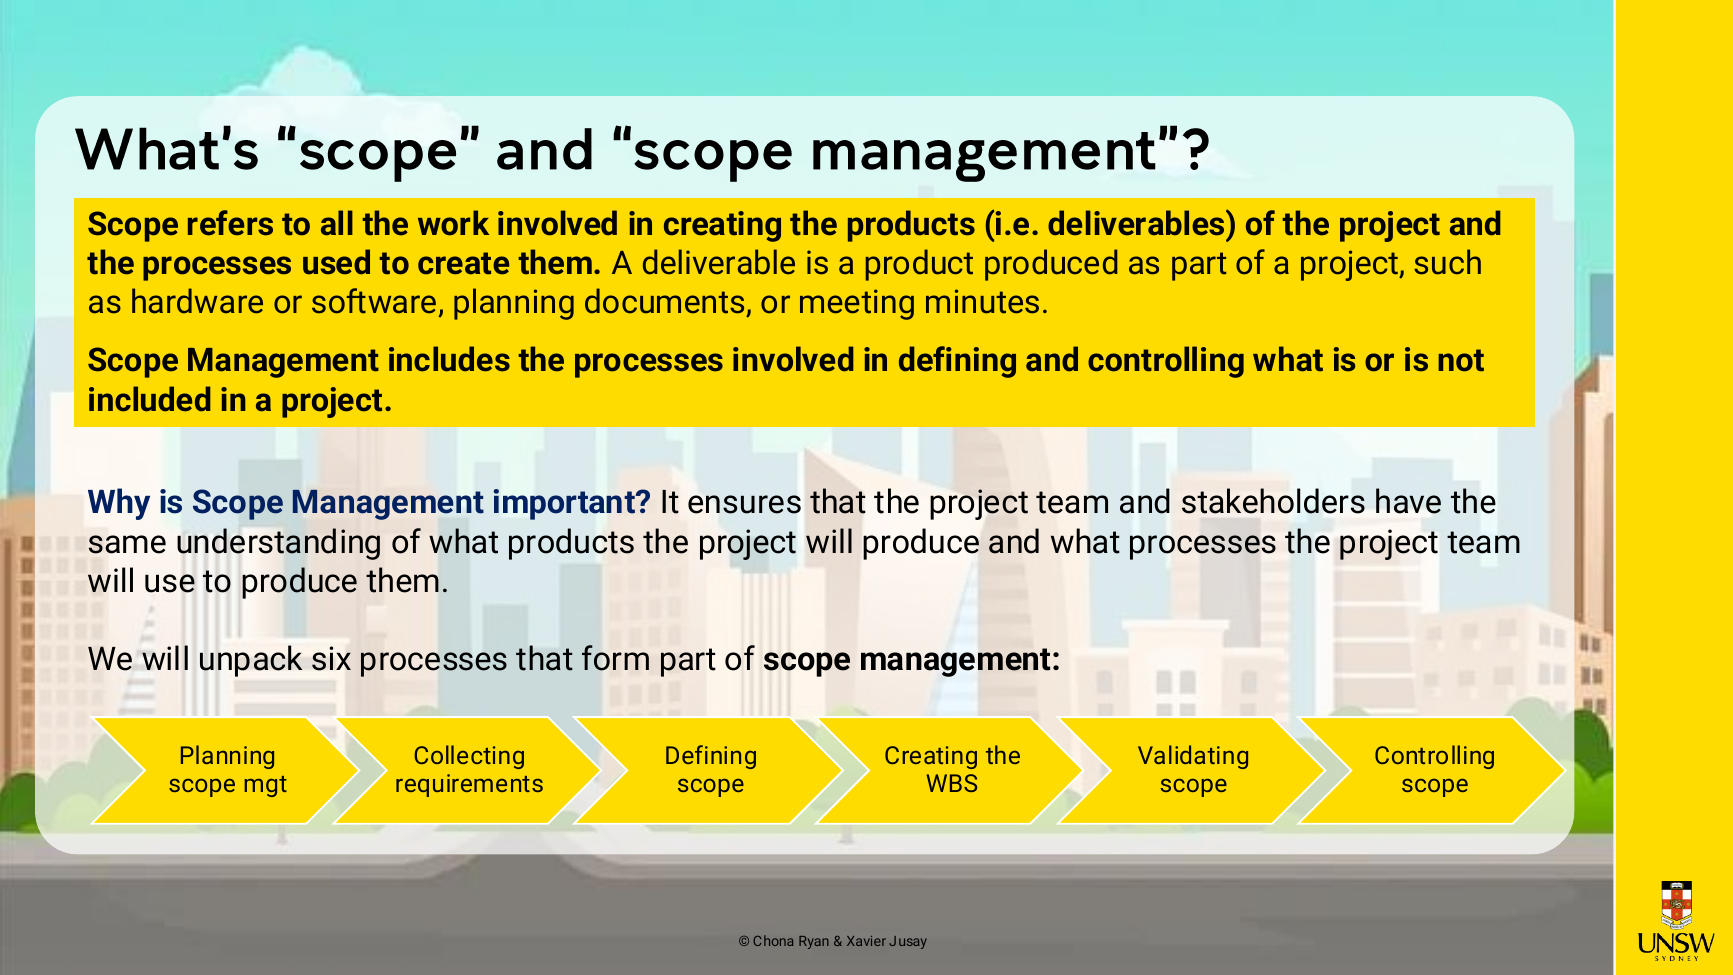
WEEK4/INFS3703 Wk04 Seminar.pdf, slide 8 (PDF page 8).Collecting requirements. A requirement is "a condition or capability needed by a user to solve a problem or achieve an objective". Requirements are unclear early, so iterate. Techniques: interviews, focus groups/workshops, group creativity techniques, surveys, observation, benchmarking. Three categories to know cold:
| Category | Focus | Example (slide 11) |
|---|---|---|
| Business requirement | What the organisation wants to achieve | "Reduce customer onboarding time by 30%" |
| Functional requirement | What the system should do | "Users can log in using multi-factor authentication" |
| Non-functional requirement | How the system should perform | "Response time must be under 2 seconds" |
Requirements are tracked in a Requirements Traceability Matrix (RTM) — number, name, category, source, status. [Transcript] In-class heuristics: a functional requirement is "something you're gonna need to develop or code"; industry keeps RTMs in Excel, Jira or Confluence; and every number in an NFR must be justified — benchmarks may be reasonably assumed in this course ("Make up the benchmark… what matters is the reasoning": faster response = more computing power = more cost — the triple constraint again).
Defining scope. The Project Scope Statement contains at least: project description (objectives, justification), detailed deliverable descriptions, product characteristics and requirements, user acceptance criteria, constraints and assumptions. You charter first at high level, then refine — scope should get more specific over time (a Version 1 vs Version 2 server example was shown). (Slide 12.)
Creating the WBS. The Work Breakdown Structure is a deliverable-oriented grouping of the project's work that defines its total scope — the basis for planning schedules, costs, resources and changes. Built by decomposition (splitting deliverables into smaller pieces). Scope baseline = scope statement + WBS. Design rules: outcomes not actions at upper levels; at least 3 levels; the WBS covers 100% of scope; each unit of work appears in exactly one place; a parent equals the sum of its children; each item has exactly one accountable owner; involve the team for buy-in; document each item in the WBS dictionary (detailed item descriptions — the lecturer admitted industry rarely maintains one, but it is examinable). The lowest level is the task: has a duration, an outcome, and named resources — the level a PM monitors. Five ways to develop a WBS: guidelines/templates, analogy (reuse a similar project's WBS), top-down, bottom-up, mind mapping. [Transcript] Exam hint: you will not be asked to draw a WBS — expect compare-and-contrast questions about the approaches; and put an action verb in front of every level-3 task so it could be handed to a developer. (Slides 14–18.)
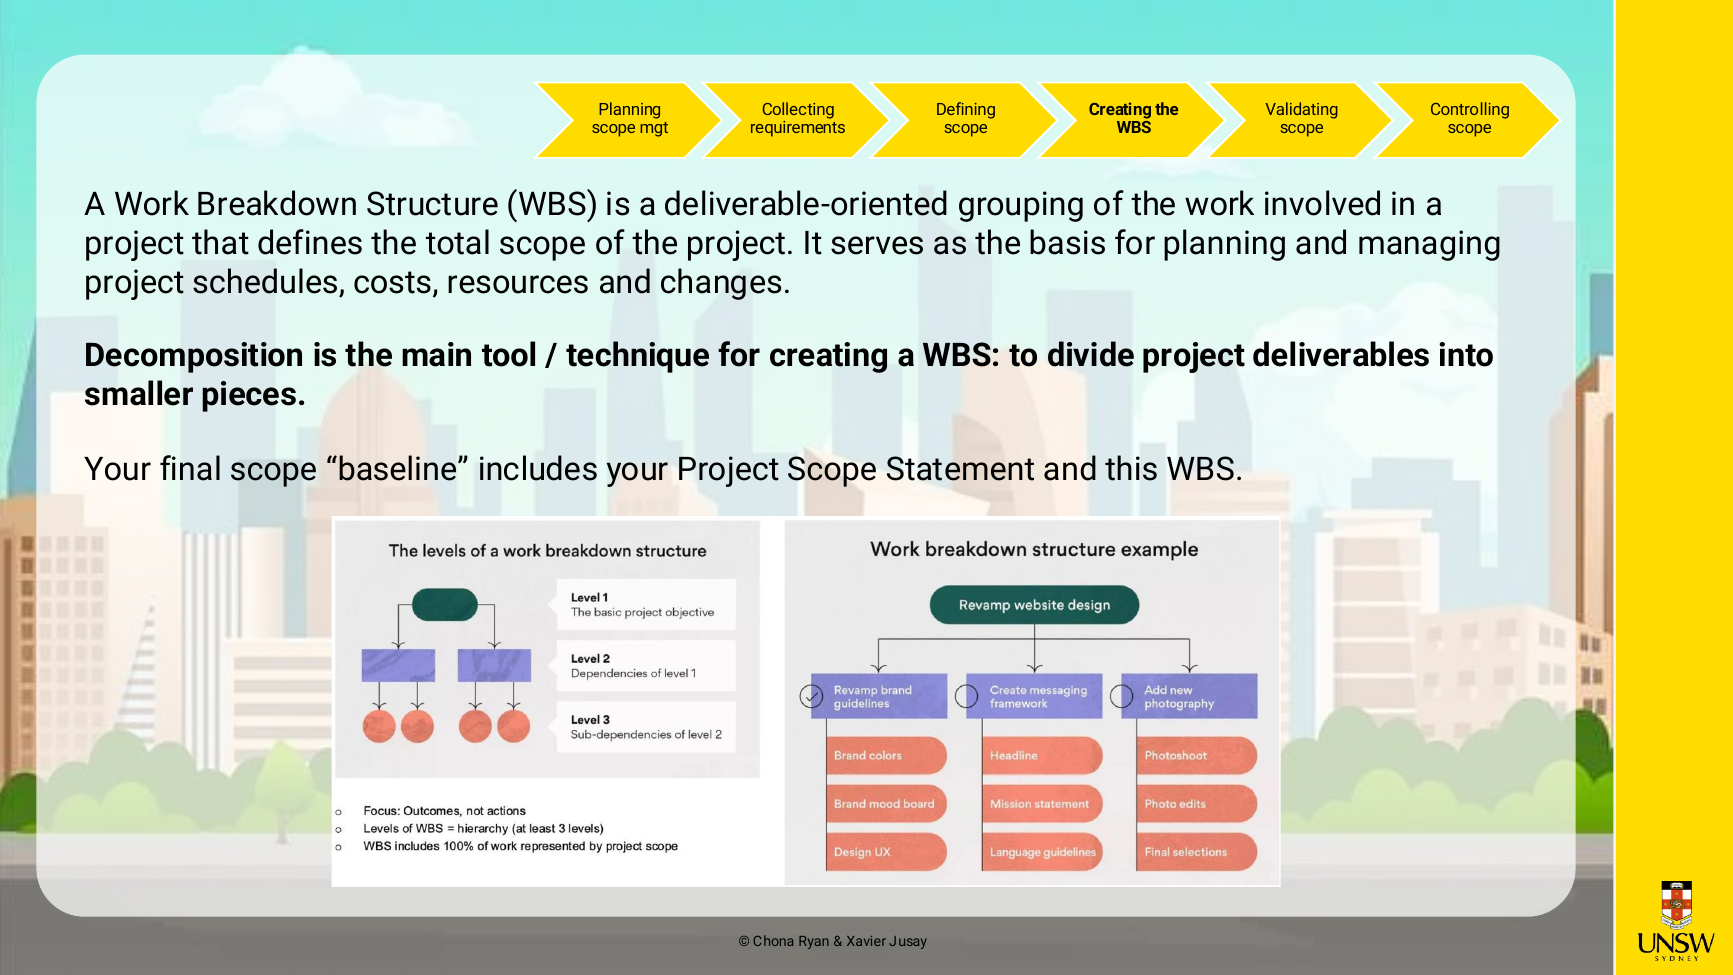
WEEK4/INFS3703 Wk04 Seminar.pdf, slide 14 (PDF page 14).Validating and controlling scope. Scope validation = formal acceptance (sign-off) of completed deliverables — bluntly framed in class as a "cover your ass policy": sign-off makes others part of the decision. Scope creep = scope growing beyond the original baseline; a key cause of failure, since budget and schedule were set for a smaller project. Controls: improve user input (regular delivery, meetings, sign-offs) and reduce changing requirements (requirements database, prototyping and testing throughout, systems-perspective reviews, and a formal change request process — every change needs a why plus an impact assessment against scope/time/cost). (Slides 21–22; transcript.)
Important terminology and frameworks
Scope; deliverable; scope management; requirement; business/functional/non-functional requirements; RTM; Project Scope Statement; WBS; decomposition; scope baseline (= scope statement + WBS); task; WBS dictionary; scope validation; scope creep; scope control; the six scope processes; the five WBS approaches; the action-verb rule for tasks; change control with triple-constraint impact assessment. (Definitions as taught on slides 8–22 — see the beginner explanation above.)
Examples and visual material
- Timetable-integration requirements example (slide 13): Business "improve schedule visibility to reduce missed classes"; Functional "display the timetable in real time"; Non-functional "update timetable changes within 5 minutes".
- RTM example row (slide 11): R32 "Laptop memory", sourced from the charter and laptop specs, status complete.
- "Construction of a House" bottom-up WBS and "IT Upgrade Project" mind map (slide 16); Microsoft Project WBS + Gantt (slide 15, textbook Figure 5-5).
- Dossier evidence for the scope call (Week 4 Dossier, 12 pages, Documents 1–11, three of them audio): students' wish list via Peter Good's voicemail; Facilities ("we can't become the back office for an app"); the Library's caution on live seat data; the post-it "feature wall" photo — the visual embodiment of scope-creep pressure.
- [Transcript] In-class WBS activity: groups building 3-level WBSs discovered hidden work (cross-device compatibility, data gathering, security) — decomposition's whole point.
- Figures 7, 8 above.
Required pre-class preparation
[Official] Using the Week 4 dossier's 11 documents, define what is in scope and out of scope for the current version of Project Pulse — "What exactly are we delivering, and what are we not delivering?" The dossier again deliberately contains conflicting information. Reading: Chapter 5. Due 9 pm the night before the seminar. (Wk03 Seminar slide 24 set the task; Week 4 Dossier p. 1; CoPC Guide.) [Transcript] From this week, submission is via Moodle (Class Notebook retired).
Evidence of completed pre-work
Status: Completed.
Final artefact: WEEK4/final pre work提交.docx (提交 = "submission"); the same content also exists as WEEK4/Week 4 Dossier vfinal.pdf.
⚠ Filename trap:
Week 4 Dossier vfinal.pdfis not the official dossier — inspection shows it is a PDF export of the student's own condensed pre-work. The official dossier is the 9.2 MBWeek 4 Dossier.pdf.
[Student work] The submitted artefact has six sections: (1) a scope-decision summary recommending "a modest information based release, not a full smart campus platform"; (2) an evidence table interpreting all 11 dossier sources into scope implications; (3) a three-column V1 scope decision table — In Scope (12 items: campus maps, accessible routes, services directory, links-only wellbeing directory, events from an existing feed, study zone info, quiet space finder, indicative busy periods, links to existing booking tools, closure/lift-outage info, owned feedback feature, modest sustainability content), Later Phase (10 items incl. timetable integration, direct room booking, real-time occupancy, push notifications) and Not Planned (8 items incl. behavioural tracking, new sensors, wellbeing triage, emissions claims); (4) a basic Project Scope Statement (objective, product scope, deliverables, acceptance criteria — "each data item has a named source and update owner" — exclusions, constraints, assumptions); (5) a mini top-down WBS for Study Space Discovery (1.1 confirm data sources … 1.4 review and validate); (6) scope-creep controls and open questions. A richer 11-section working version (Week4_CoPC_Scope_Management_Project_Pulse_FINAL.html/.pdf) adds a full RTM (BR-01…NFR-03) and a 3-level 6-work-package WBS, with each exclusion showing its triple-constraint impact if added.
Versions (all 20 June 2026, timestamped chain): before_revision.html 21:35 → revised .html 21:41 → FINAL.html/.pdf 22:08–22:12 (full 11-section version) → BASIC.html/.pdf 22:45 (condensed 6-section) → final pre work提交.docx 22:52 → Week 4 Dossier vfinal.pdf 22:58. The condensed version created last, named "submission", is judged the submitted deliverable; which exact file went to Moodle cannot be confirmed.
Key points to remember
- Scope management = defining and controlling what is and is not included; six processes in order.
- Business vs functional vs non-functional requirements + RTM — directly practised, and flagged as Path B Exam 2 material.
- Scope baseline = scope statement + WBS; WBS is deliverable-oriented, ≥3 levels, 100% of scope, one owner per item.
- Five WBS approaches — exams compare approaches rather than ask for drawings; use action verbs at task level.
- Scope validation is formal sign-off; scope creep is a top failure cause; control changes through a formal change-request process with triple-constraint impact assessment.
- [Transcript] Marking philosophy (applies to everything): "If you don't justify and reason I can't pass you." Short description, long justification. There is no single right scope answer — reasoning referencing specific dossier documents is what scores.
- [Transcript] Exam intelligence: Path B Exam 2 (Week 7, 15%) covers Weeks 4–5 (scope + schedule), assuming Weeks 1–3; the Path A final is ~3–4 multi-part questions in 2 hours, typed, no reference sheet.
Sources used
WEEK4/INFS3703 Wk04 Seminar.pdf(25 content slides; esp. 6–23)WEEK4/Week 4 Dossier.pdf(official, 12 pages, Documents 1–11)WEEK4/Document 3/5/6 …(transcribed…).txt(case audio transcripts; Maya transcript partially garbled)WEEK4/seminar recording transcript.txt(Monday seminar; extensive lecturer guidance)assessments/INFS3703 CoPC Assessment Guide.pdf- Student versions:
final pre work提交.docx[final],Week 4 Dossier vfinal.pdf[same content],Week4_CoPC_Scope_Management_Project_Pulse_FINAL/BASIC/before_revision…[drafts/working versions]
7. Week 5 — Schedule Management
Weekly focus
Turning scope into a credible timeline: the seven schedule-management processes, activity lists and milestones, dependency types, network diagrams (AOA vs PDM), duration vs effort and three-point estimates, Gantt charts, critical path, float, and schedule compression (crashing, fast-tracking, buffers). Project Pulse: the sponsor asks, "Based on your recommended scope, can this be delivered before next academic year?" (assume before end of February 2027). Pre-work = WBS + activity list + network diagram; the 60-minute in-class activity turned that into a draft Gantt chart and 5-milestone sponsor schedule. Reading: Chapter 6.
Beginner explanation of the content
Why schedules are hard. Time is the least flexible constraint — it passes no matter what, and many projects have "drop dead" dates. Different work styles and cultures treat deadlines differently; delivering on time is one of PMs' biggest challenges. (Slides 6–7; transcript anecdotes about Dutch/Australian/Philippine attitudes to punctuality.)
Seven processes: plan schedule management → define activities → sequence activities → estimate activity resources → estimate activity durations → develop the schedule → control the schedule. (Slide 7.)
Defining activities. Schedules grow out of the charter (dates, budget) and the scope statement + WBS (the work). An activity is a WBS element with an expected duration, cost and resource needs. An activity list tabulates them; attributes add predecessors, successors, relationships, constraints. A milestone is a significant event with zero duration — and must be SMART (Specific, Measurable, Assignable, Realistic, Time-framed). (Slides 9, 16.)
Sequencing: dependencies. Three dependency reasons: mandatory ("hard logic" — inherent in the work), discretionary ("soft logic" — team choice, use with care), external (project ↔ non-project). Four dependency relationships (textbook Figure 6-3): finish-to-start (FS) — B starts after A finishes (the common one); start-to-start (SS); finish-to-finish (FF); start-to-finish (SF). [Transcript] "It's not always the finish-to-start model" — asking "are there any dependencies?" is the question that makes you look smart at work.
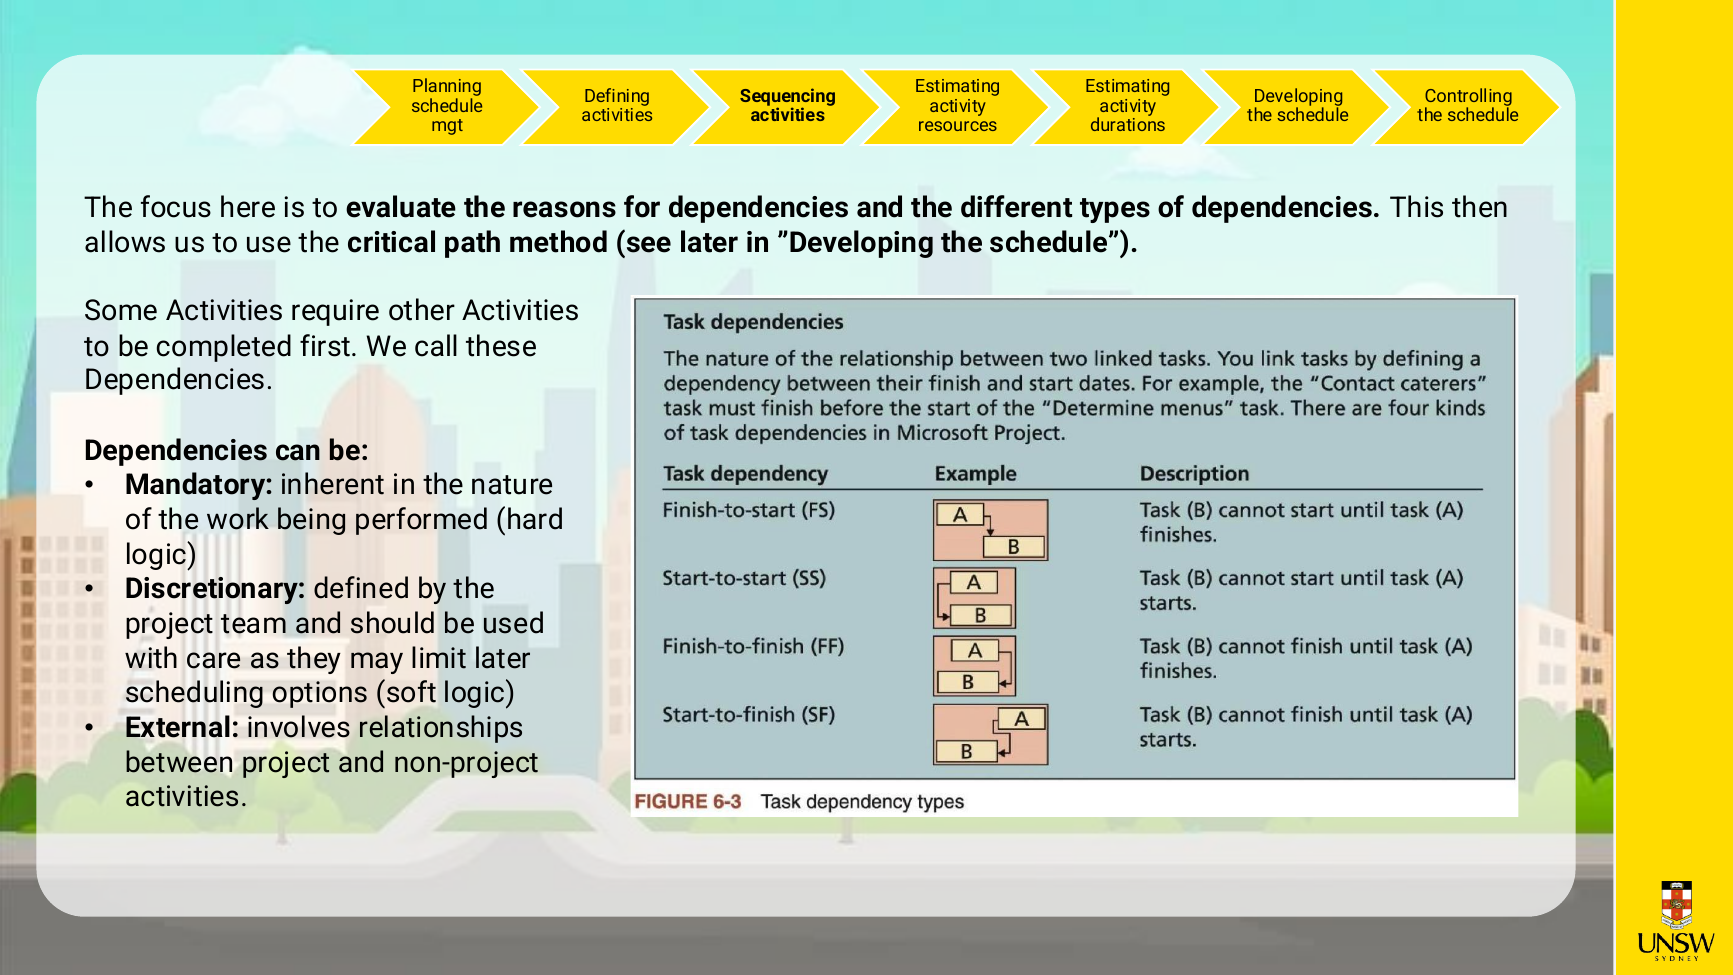
WEEK5/INFS3703 Wk05 Seminar.pdf, slide 10.Network diagrams. Two formats: AOA/ADM (activity-on-arrow: arrows are activities, nodes are events; can only show finish-to-start) with a 3-step drawing method (find activities from node 1; work left-to-right spotting bursts — one node followed by 2+ activities — and merges; no crossing arrows), and PDM (precedence diagramming method: boxes are activities, arrows are relationships) — more popular, used by PM software, and able to show all four relationship types. [Transcript] The lecturer's odds you'll use AOA in real life: "probably close to zero" — PDM is what Microsoft Project uses; the value is the analytical thinking. (Slides 11–13.)
Estimating. Durations should be estimated by the people doing the work, reviewed by an expert. Three-point estimates = optimistic / most likely / pessimistic. Duration ≠ effort: duration includes elapsed waiting time (approvals, delays, dependencies); effort is the work-hours. [Transcript] Consider who does the work (junior vs senior speed), use benchmarks, be ready to justify durations — and say "people", not "resources". (Slide 14.)
Developing the schedule: Gantt charts and the critical path. A Gantt chart lists activities against calendar dates; milestones appear as diamonds; arrows show dependencies (textbook Figure 6-6). The critical path is the longest path through the network — the series of activities determining the earliest completion date, with the least float. Free float: how long an activity can slip without delaying its immediate successor. Total float: how long it can slip without delaying the project finish — critical-path activities have zero. To compress a schedule: shorten critical activities (more resources / less scope), crash (maximum compression on critical activities), or fast track (overlap activities in parallel — risky, e.g. running UAT and SIT together). Buffers absorb estimating uncertainty. (Slides 16, 18.)
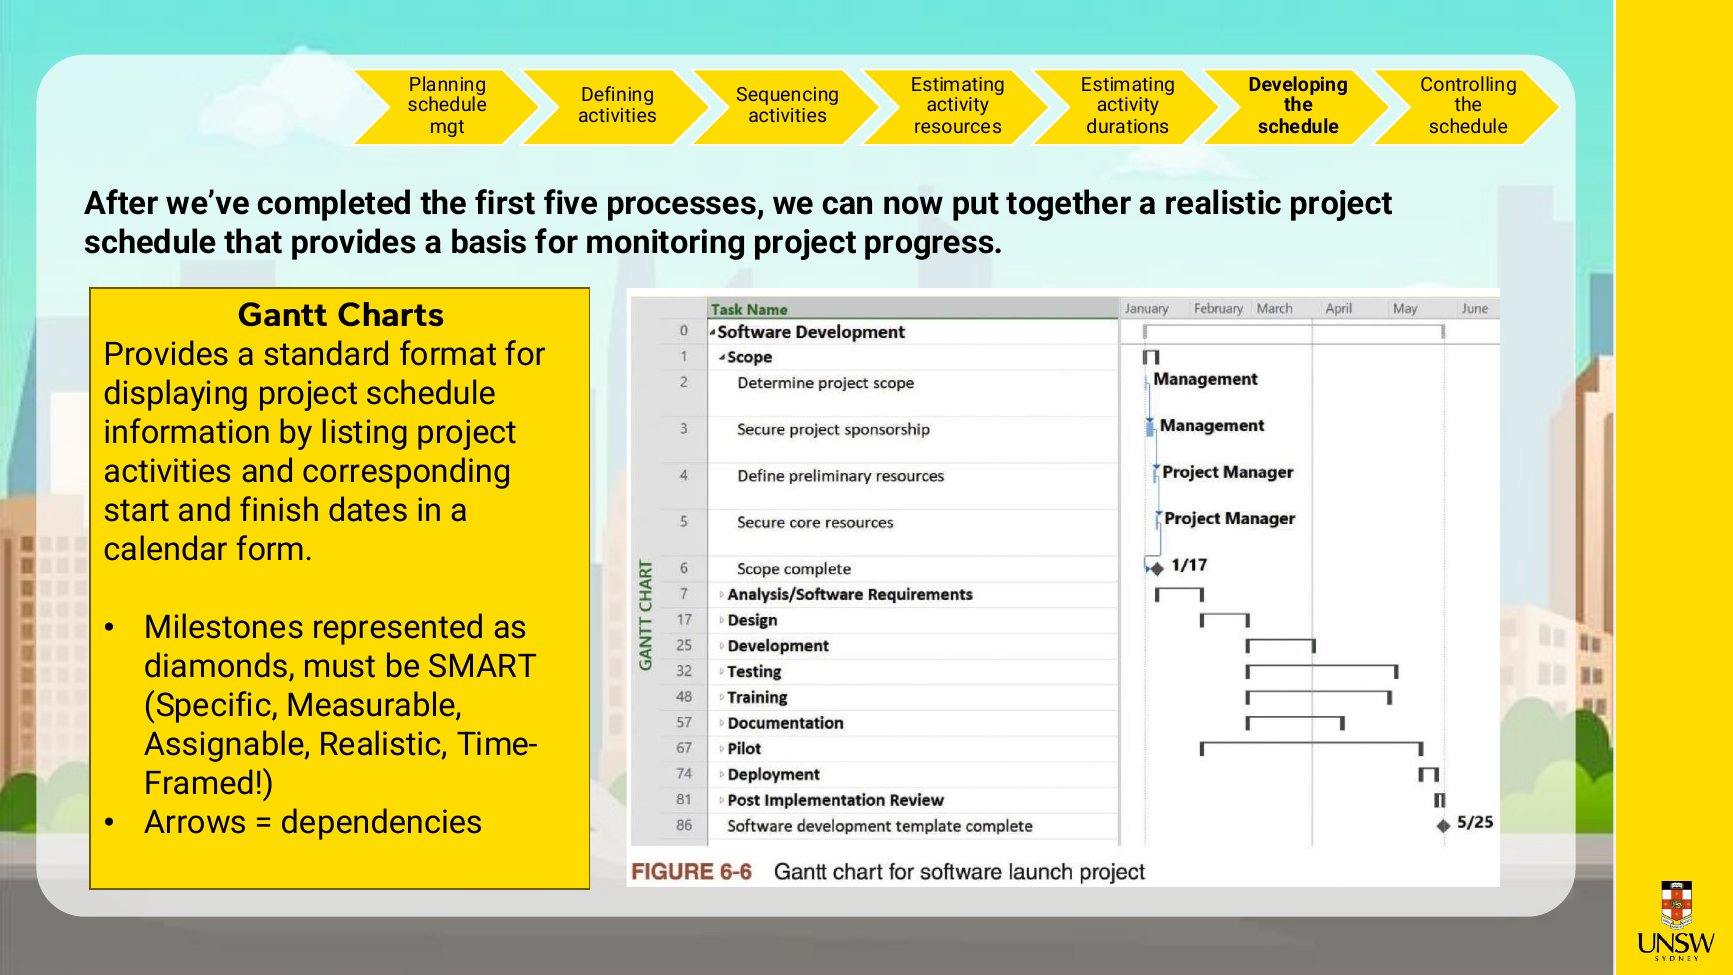
WEEK5/INFS3703 Wk05 Seminar.pdf, slide 16.Controlling the schedule. Reality checks: review the draft against the charter, keep it realistic, alert management early. Agile may avoid a detailed upfront schedule, but it still estimates and forecasts iteratively — through backlog refinement, sprint/release planning and measures such as velocity (see Week 3's process-groups-in-Agile mapping; the slide cites the Manifesto value "responding to change over following a plan"). Beware PM-software templates used without thought. (Slide 20; Wk03 Seminar, slide 21.) Sponsor-facing tip that shaped the in-class task: sponsors get a short milestone schedule (~5 decision-point checkpoints), not your whole Gantt.
Important terminology and frameworks
Activity; activity list/attributes; milestone (zero-duration, SMART); mandatory/discretionary/external dependencies; FS/SS/FF/SF; AOA/ADM; PDM; burst; merge; three-point estimate; duration vs effort; Gantt chart; critical path; free float; total float; crashing; fast tracking; buffer; the seven schedule processes; the schedule management plan (7 components); the NETWORKDAYS-based course Gantt template. (As taught on slides 7–20 and the course template workbook.)
Examples and visual material
- "Project X" sample AOA and PDM diagrams (slides 11–13) — the worked example for the drawing steps.
- Software-launch Gantt (slide 16, Figure 6-6).
- Dossier constraints (Week 05 Dossier): IT — early work can start, but build must not get ahead of agreed scope, confirmed data sources, and the architecture review ("must not be scheduled one day before build"); reviewers — privacy/security/accessibility review "must not be a single final step" because reviews produce changes; Facilities/Library — some accessibility data is outdated, live seat availability cannot be promised, and a few pilot buildings are far more manageable; the draft milestone whiteboard (Doc 6, image-only page) with the prompt "What is the minimum credible path to something useful before next academic year?"
- [Transcript] Industry colour: Westpac's tiered gold/bronze/silver/platinum milestones; consulting fees tied to milestones; UAT+SIT in parallel as risky fast-tracking.
- Figures 9, 10 above.
Required pre-class preparation
[Official] Using the dossier and your own Week 4 scope decision, produce: (1) a completed WBS (top-down, bottom-up or mind-map); (2) an activity list linked to WBS items — explicitly no time or resource estimates; (3) a network diagram showing key dependencies. A full Gantt was not required — it is built in class. Deferred Week 4 features must not appear unless clearly marked future-phase. Reading: Chapter 6. Come prepared to explain how your Week 4 scope decision affects your Week 5 schedule. (Week 05 Dossier, p. 1; Wk05 Seminar, slide 5; CoPC Guide.) ⚠ Note: seminar slide 3 says "Reading: Chapter 5" — the dossier (filename and p. 1) says Chapter 6; the slide appears to be a typo.
Evidence of completed pre-work
Status: Completed.
Final artefact: WEEK5/Wk 5 Prep work final.pdf (export of Week5_CoPC_Schedule_Management_Project_Pulse_SUBMIT_NATURAL.html).
[Student work] Contains all three required items plus extras: a top-down WBS "1.0 Project Pulse V1 Controlled Pilot" with 11 Level-2 work packages (1.1 confirm scope … 1.11 sponsor approval) and action-verb Level-3 tasks; a 16-row activity list A01–A16 each linked to a WBS item with predecessor and dependency type (e.g. "A03 (1.2) Identify and confirm data owners — predecessor A02 — External"), deliberately with no durations; and a PDM-style network diagram (A01→A02→A03 fanning into parallel content streams A04–A09, early architecture A10 and privacy wording A12 in parallel, merging at the A11 architecture review → A14 build → A13 security/accessibility review → A15 student testing → A16 rework and sponsor approval). It names the biggest schedule risk — the external dependency on data owners (A03) blocking the whole content path — lists 7 assumptions, and concludes a controlled pilot (not full release) is credible before end of February 2027.
Versions: BASIC.html (27 Jun 23:17; byte-identical to BASIC_full_with_notes.html despite the name) contains draft-only extras including a Chinese self-check against the marking rubric → SUBMIT.html 23:36 (self-check removed; printed as Wk 5 Prep work.pdf) → SUBMIT_NATURAL.html (28 Jun 19:00; prose smoothed; printed as Wk 5 Prep work final.pdf). Substantive content is identical from SUBMIT onward.
⚠ Project Pulse Gantt Chart.xlsx is judged to be the unmodified course template (its instructions say "Replace the example rows with your own…", and its example IDs A1–A14 don't match the student's A01–A16). The actual in-class Gantt was submitted to a Teams channel per the transcript, so no completed Gantt artefact exists in this folder.
Key points to remember
- Seven schedule processes; the schedule must grow out of the scope/WBS — untraceable activities get removed or marked future-phase.
- Milestones: zero duration, SMART, sponsor-facing (sponsors see ~5 milestones, not your Gantt).
- Dependencies: mandatory/discretionary/external × FS/SS/FF/SF — the four relationship types were specifically emphasised.
- PDM beats AOA in practice; AOA can only show finish-to-start.
- Duration ≠ effort (waiting time counts in duration); estimate three-point, by the people doing the work.
- Critical path = longest path, zero total float; compress by adding resources/descoping, crashing, or fast-tracking (risky); buffers absorb uncertainty.
- Reviews (architecture, privacy, security, accessibility) are schedule gates that produce rework — never plan them as a single final step.
- [Transcript] The triple constraint and its trade-offs were explicitly flagged as exam-relevant; when a deadline is fixed and the schedule slips: descope (change request), fast-track, add people, or negotiate.
- [Transcript] "No pre-work for two weeks" — Week 6 is Flex Week; Week 7's cost/quality pre-work was briefed on slide 21.
Sources used
WEEK5/INFS3703 Wk05 Seminar.pdf(25 slides; esp. 5–22)WEEK5/Week 05 Dossier - Refer Chapter 6 of your textbook.pdf(9 pages; Docs 1–6)WEEK5/Wk 05 Supporting - Document 4 - Keiran Maya You Conversation.txt(case audio transcript)WEEK5/wk5 seminar rec.txt(seminar transcript, garbled ASR)WEEK5/Project Pulse Gantt Chart.xlsx(course template; Instructions + Gantt + Milestone sheets)- Student versions:
Wk 5 Prep work final.pdf[final],…SUBMIT_NATURAL.html,…SUBMIT.html,…BASIC.html(+ byte-identical_full_with_notes),Wk 5 Prep work.pdf assessments/INFS3703 CoPC Assessment Guide.pdf
8. Week 6 — Flex Week (no teaching)
What happened
Week 6 was a scheduled non-teaching Flex Week: no seminar, no topic, no CoPC pre-work, and no Path B exam. Confidence: High — this is official, not inferred from the missing folder:
- [Official] Every seminar deck's course-map slide labels the column between Weeks 5 and 7 "Week 6 – Flex Week" with no topic and no assessment beneath it (verified visually on Wk01 slide 8, Wk05 slide 2, Wk07 slide 2, Wk09 slide 2 — see Figure 1).
- [Official] The CoPC Assessment Guide defines the weekly pre-work regime as "Weekly: Weeks 2–5, 7–9 inclusive" (p. 1) — Week 6 is explicitly outside it.
- [Official] The Week 5 deck's closing assignment slide (slide 21) is titled "Project Pulse — your pre-work for Week 7" — the pre-work assigned at the end of Week 5 skips Week 6 entirely.
- [Transcript] Week 5 seminar: "You won't have to do it now for two weeks, so it's fine" (on pre-work).
- Path B exams bracket but never touch Week 6: Exam 1 in Week 4, Exam 2 at the start of the Week 7 seminar.
Pre-work status
No pre-work requirement identified. No Week 6 artefacts exist anywhere in the archive, which reflects the course design rather than missing material.
Limitation
⚠ No document states what students were encouraged to do during Flex Week (catch-up, team-project work, exam revision) — the official materials only label it "Flex Week". Course outline/Moodle announcements are not in the folder.
Sources used
WEEK1/INFS3703 Wk01 Seminar.pdfslide 8;WEEK5/INFS3703 Wk05 Seminar.pdfslides 2, 21;WEEK7/INFS3703 Wk07 Seminar.pdfslides 2–3;WEEK9/INFS3703 Wk09 Seminar.pdfslide 2assessments/INFS3703 CoPC Assessment Guide.pdf(p. 1)WEEK5/wk5 seminar rec.txt
9. Week 7 — Cost & Quality Management
Weekly focus
Two core knowledge areas in one seminar. Cost: the four cost processes, cost vocabulary (direct/indirect, sunk cost, contingency vs management reserves), the three estimate types (ROM/budgetary/definitive), four estimating techniques, and Earned Value Management (EVM) with the full formula set and a worked scenario. Quality: ISO definitions, the three quality processes, quality dimensions of IT products, cost of quality, testing levels, and the seven basic quality tools. Project Pulse: revisit your Week 4 scope, build a high-level cost estimate in a supplied Excel template from indicative dossier costings, and define process quality and deliverable quality. Path B students sat Exam 2 (15%) in the first part of this seminar. Reading: Chapters 7 and 8.
Beginner explanation of the content
Cost basics. Cost is a resource sacrificed or foregone to achieve an objective, usually measured in money; cost management ensures the project completes within its approved budget through four processes: plan cost management → estimate costs → determine the budget → control costs. IT projects have a poor budget track record, and executives speak financial language — so PMs must too. Key vocabulary: lifecycle costing (total cost of ownership: development + support); tangible vs intangible costs/benefits; direct vs indirect costs; sunk cost — money already spent, which must not influence continue/stop decisions; contingency reserves for "known unknowns" (inside the cost baseline) vs management reserves for "unknown unknowns" (outside it). (Slides 7–9.)
Estimates. Three types, by timing and accuracy: ROM (rough order of magnitude) — very early, for selection decisions, −50%/+100%; budgetary — 1–2 years out, −10%/+25%; definitive — under a year out, −5%/+10%. Four techniques: analogous/top-down (base on a similar past project), bottom-up (sum the pieces), three-point (most likely / optimistic / pessimistic), parametric (mathematical model). Estimates go wrong because they're rushed, inexperienced, human-biased toward underestimation, or pressured by management. The textbook Surveyor Pro example shows a WBS-structured estimate (with 20% reserves) becoming a time-phased cost baseline. (Slides 10–13.)
Earned Value Management. EVM combines scope, time and cost into one measurement against the approved baseline:
| Term | Formula | Question it answers |
|---|---|---|
| PV — Planned Value | planned budget for work scheduled | How much should be done by now (in $)? |
| AC — Actual Cost | money actually spent | What have we spent? |
| EV — Earned Value | Budgeted value of the work actually completed | How much budgeted work has actually been earned? |
| CV | EV − AC | Under/over budget for work done? (negative = over) |
| SV | EV − PV | Ahead/behind schedule? (negative = behind) |
| CPI | EV ÷ AC | Value per dollar spent (<1 = trouble) |
| SPI | EV ÷ PV | Progress rate vs plan (<1 = behind) |
| BAC | total approved budget | — |
| EAC | BAC ÷ CPI | Projected final cost — this forecast assumes the current cost performance continues for the remaining work |
| ETC | EAC − AC | Money still needed from now |
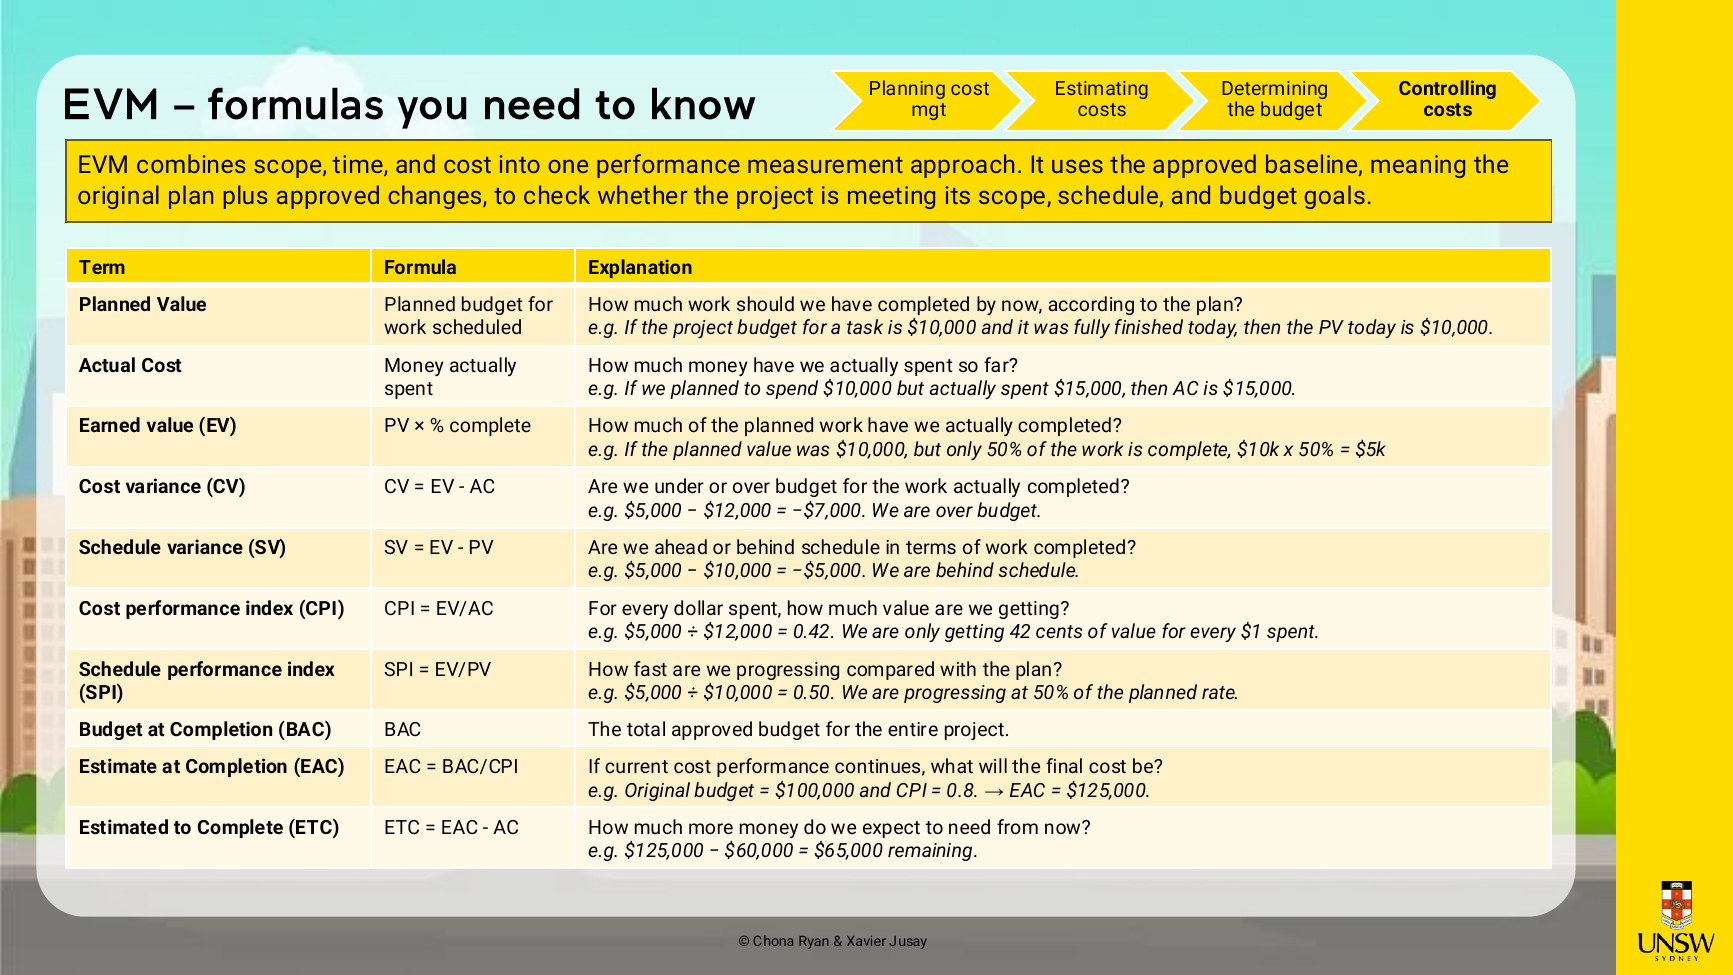
WEEK7/INFS3703 Wk07 Seminar.pdf, slide 16.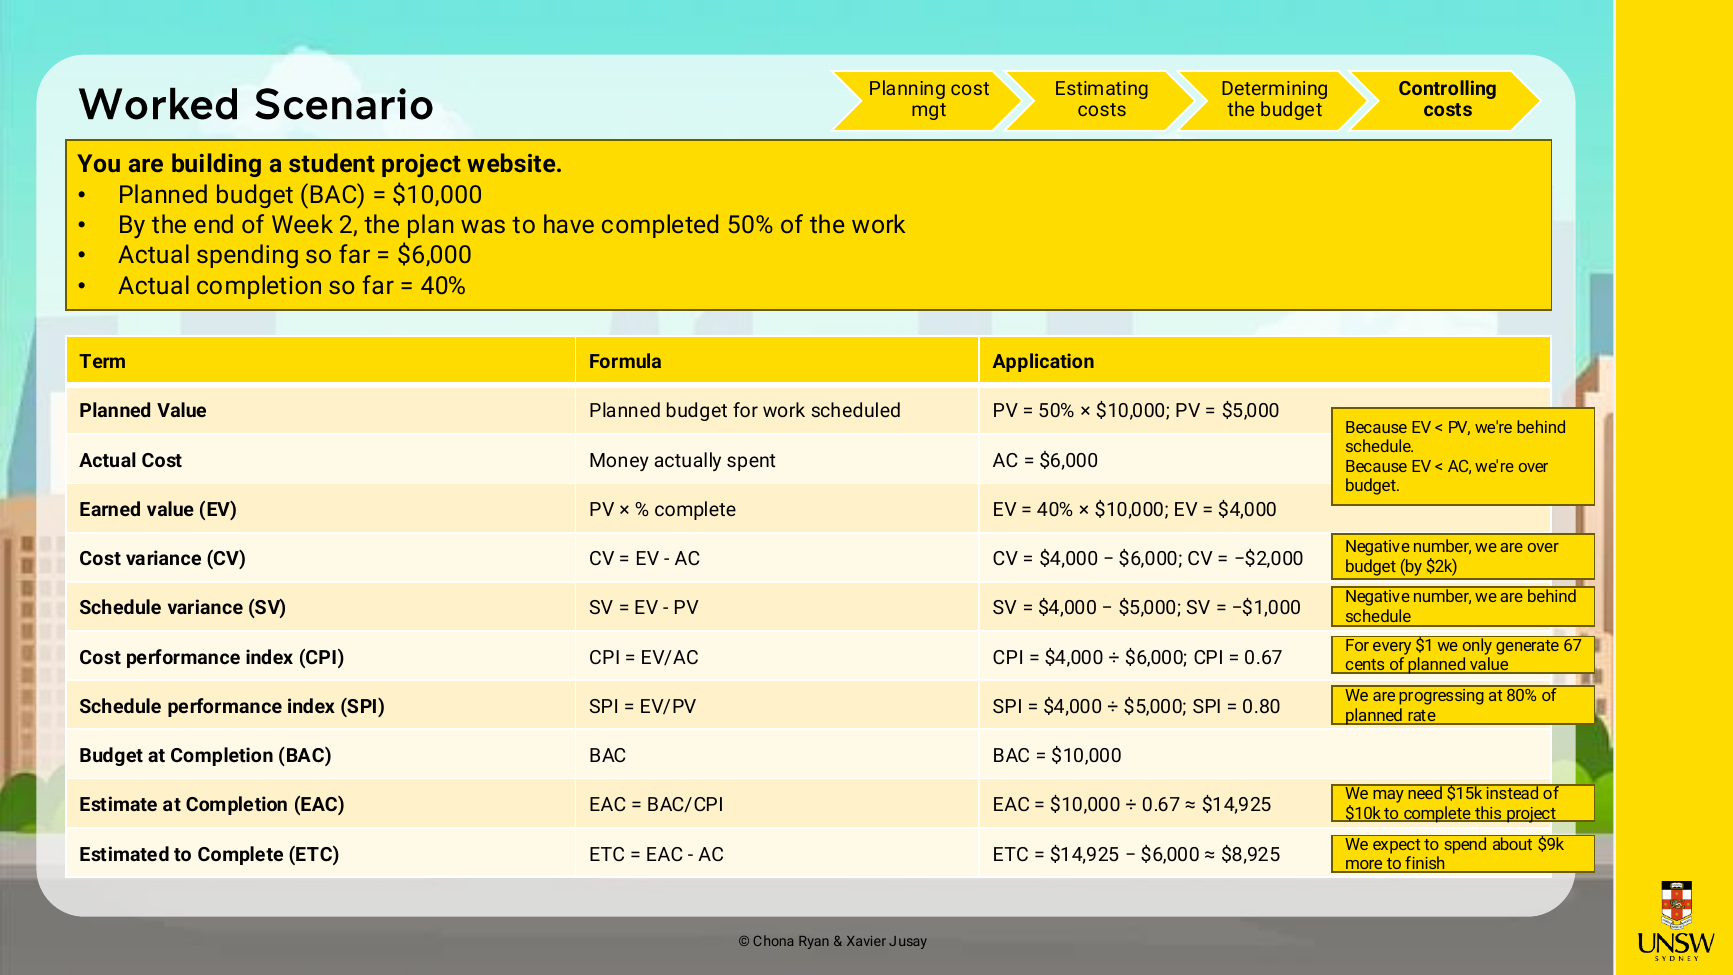
WEEK7/INFS3703 Wk07 Seminar.pdf, slide 17.⚠ Noted inconsistency in the official deck (verified directly): the slides label the formula as "EV = PV × % complete", but the worked scenario computes EV = 40% × $10,000 (the BAC) while PV at that date is $5,000. Properly, Earned Value is the budgeted value of the work actually completed. In this simplified single-budget example that gives EV = BAC × actual percentage complete = $10,000 × 40% = $4,000 — exactly what the slide computes, so the worked example is internally consistent when EV is read as the budgeted value of completed work. This simplified calculation works because the example treats the entire project as one budgeted unit; do not treat "BAC × percentage complete" as the universal EVM formula for all projects.
Rule of thumb drilled in class: compare EV to PV for schedule, EV to AC for cost. In the in-class quiz (PV $50k, EV $40k, AC $55k) the project is behind schedule and over budget. AgileEVM adapts EVM to Scrum using backlog, release plan and velocity — any consistent numerical unit works. Spreadsheets remain the dominant tool ("for this type of project, just use simple Excel"). (Slides 16–20; transcript.)
Quality. ISO definitions: "the totality of characteristics of an entity that bear on its ability to satisfy stated or implied needs" (ISO 8042:1994); "the degree to which a set of inherent characteristics fulfils requirements" (ISO 9000:2000). Also: conformance to requirements and fitness for use. Three processes: plan quality → manage quality → control quality. Quality is multidimensional (the restaurant example) and applies to both the product and the PM process — poor process leads to poor product. Six IT product quality dimensions: functionality, features, system outputs, performance, reliability, maintainability (bank-app illustration: transferring money = functionality; within seconds = performance; works repeatedly = reliability; Face ID = feature). Managing quality includes benchmarking and quality audits; controlling quality produces three outcomes: acceptance decisions, rework, process adjustments. Cost of quality = cost of conformance + cost of nonconformance (prevention, appraisal, internal failure, external failure, plus measurement/test equipment). Testing belongs throughout the lifecycle: unit → integration → system → user acceptance testing; the classic mistake is not budgeting time to fix what testing finds. The seven basic quality tools: fishbone (cause-and-effect) diagram, control chart, checksheet, scatter diagram, histogram, Pareto chart (80–20 rule), flowchart (+ run charts). (Slides 23–34; transcript.)
Important terminology and frameworks
Cost; cost management (4 processes); lifecycle costing; direct/indirect; sunk cost; contingency vs management reserves; control account; ROM/budgetary/definitive; analogous/bottom-up/three-point/parametric; cost baseline; the full EVM set (PV, AC, EV, CV, SV, CPI, SPI, BAC, EAC, ETC); AgileEVM; ISO quality definitions; conformance/fitness-for-use; QA vs QC; acceptance/rework/process adjustments; cost-of-quality categories; unit/integration/system/UAT; the seven quality tools; contingency guidance bands from the case data (10–15% low, 15–25% moderate, 25–40% high uncertainty — Document 2 - Indicative Costing Notes.xlsx).
Examples and visual material
- Worked EVM scenario (Figure 12) and the in-class quiz (PV 50/EV 40/AC 55 → behind schedule and over budget).
- Surveyor Pro textbook estimate → time-phased baseline (slides 12–13).
- [Transcript] Industry stories: the ~$100M Bureau of Meteorology weather-app blowout (scope creep + stage gates that kept approving increases); sunk-cost examples (abandoned $500k consultancy design); a 20,000-user platform go-live preceded by a 500-user pilot with exit criteria "no critical and no high issues"; "a fool with a tool is still a fool" (training/change management is the most underestimated cost).
- Defect MCQ (transcript): recurring wrong room-availability data → correct answer is investigate the process causing repeated defects, not patch/accept/work around.
- Figures 11, 12 above.
Required pre-class preparation
[Official] Three tasks (Week 7 Dossier, p. 1): (1) revisit and update your Week 4 scope decisions before estimating — flag anything now too costly, too risky, or too quality-sensitive for the first release, with reasons; (2) prepare a high-level cost estimate for your version of Project Pulse by filling in the Moodle High Level Cost Estimate Template (Excel), using the dossier's indicative costing notes, stating key assumptions (pilot vs full release, internal vs vendor, basic info vs real-time occupancy, integrations in or out); (3) define quality two ways — process quality (reviews/sign-offs, privacy, security, accessibility checks, data validation before student testing) and deliverable quality (accuracy of study-space/map/accessibility/service information; usability; interface accessibility). Reading: Chapters 7–8. Due 9 pm the night before. (Also Wk07 Seminar, slide 4.)
Evidence of completed pre-work
Status: Completed.
Final artefacts: WEEK7/Week 7 CoPC Artefact最终提交.docx (最终提交 = "final submission"; PDF export …最终提交版本.pdf) with companion spreadsheet WEEK7/High Level Cost Estimate Template_FINAL.xlsx (PDF export …最终提交.pdf).
[Student work] All three tasks are covered: (1) an 8-row scope re-test of every Week 4 item (e.g. events information became conditional — "included only if a structured feed and data owner are confirmed", costed as $25,000 optional outside the baseline); (2) a 22-line cost estimate built from the dossier's indicative ranges — one-off subtotal $461,000, 20% contingency $92,200, proposed baseline $553,200, ongoing $60,000/year, with ten stated assumptions (pilot only; no offshore vendor; no real-time occupancy; platform already licensed; ~43% of the subtotal deliberately weighted toward data, assurance, testing and remediation); the estimate is explicitly labelled ROM-accuracy; (3) a 4-row process-quality table and 6-row deliverable-quality table with measurable thresholds (WCAG 2.2 AA with critical/high issues resolved pre-release; "at least 98%" data-accuracy sample audit; 80% unaided task completion; 99% availability in teaching hours), with self-set thresholds marked as assumptions. ⚠ All dollar figures and thresholds are the student's own judgements, not official answers. The seminar transcript records a presenter giving "$460,000 with 20% contingency justified by data quality" — matching this artefact — during the budget share-out (inference, since ASR garbles the numbers).
Versions: course template (High Level Cost Estimate Template.xlsx, 11 Jul 21:34 — note it ships with an 8-row example estimate, not student work) → _COMPLETED.xlsx + preview (11 Jul 22:29) → Week7_CoPC_Cost_Quality_Project_Pulse_SUBMIT.html (22:36) → _FINAL.html + Template_FINAL_preview.pdf (12 Jul ~0:52) → Template_FINAL.xlsx + 最终提交.pdf (12 Jul 20:29) → 最终提交.docx/.pdf (20:32, latest). COMPLETED→FINAL changes are wording-strengthening only; totals unchanged. Week7_Seminar_Talking_Points.md is private prep notes; 新录音 79.m4a is raw seminar audio (transcript exists).
Key points to remember
- Four cost processes; the budget's product is a time-phased cost baseline traced to the WBS.
- Estimate types cold: ROM −50/+100, budgetary −10/+25, definitive −5/+10; four techniques: analogous, bottom-up, three-point, parametric.
- Contingency reserves = known unknowns, inside the baseline; management reserves = unknown unknowns, outside it; sunk costs never drive continue/stop decisions.
- EVM is the must-know: the core EVM measures and formulas, and the reading pattern EV-vs-PV (schedule) and EV-vs-AC (cost). The lecturer confirmed exam questions test understanding (e.g. "what happens to EAC if…"), not memorised recitation. Remember that EAC = BAC ÷ CPI is a forecast that assumes the current cost performance continues for the remaining work.
- Beware the EV label on the slide — EV is the budgeted value of the work actually completed; the slide's simplified single-budget example computes EV = BAC × actual percentage complete = $10,000 × 40% = $4,000.
- Quality: ISO definitions; process vs deliverable quality; QC's three outcomes (acceptance, rework, process adjustments); cost of quality = conformance + nonconformance.
- Test at every level (unit/integration/system/UAT) and budget time to fix findings; recurring defects → investigate the process.
- Recognise all seven quality tools by sight; Pareto = 80/20.
- Project Pulse case logic: descriptive info is cheap, historical is moderate, real-time is expensive and riskiest if wrong; "wrong accessibility info is worse than none"; present a range + recommended baseline + explained contingency, not one number.
Sources used
WEEK7/INFS3703 Wk07 Seminar.pdf(37 content slides; esp. 4, 7–20, 23–35)WEEK7/Week 7 Dossier.pdf(8 pages; Docs 1–7)WEEK7/Document 2 - Indicative Costing Notes.xlsx(35 indicative cost ranges + contingency bands)WEEK7/wk7 seminar trascript.txt(seminar transcript)WEEK7/High Level Cost Estimate Template.xlsx[course template] and student versions_COMPLETED.xlsx,_FINAL.xlsx, previews,最终提交.pdfWEEK7/Week 7 CoPC Artefact最终提交.docx/.pdf[student final];Week7_CoPC_Cost_Quality_Project_Pulse_SUBMIT/FINAL.html[student drafts];Week7_Seminar_Talking_Points.md[student notes]assessments/INFS3703 CoPC Assessment Guide.pdf
10. Week 8 — Risk Management
Weekly focus
"The what-ifs": the PMBOK definition of project risk, the seven risk processes, levels of risk, risk utility, identification techniques (brainstorming, Delphi, interviewing, SWOT), qualitative analysis (probability/impact matrix, Top Ten tracking), quantitative analysis (decision trees/EMV, Monte Carlo, sensitivity analysis), response strategies for negative and positive risks, residual and secondary risks, and the RAID register. Pre-work = a Project Pulse RAID log (≥2 each of Risks, Assumptions, Issues, Dependencies) grounded in your earlier artefacts, workshopped in class. Reading: Chapter 11.
Beginner explanation of the content
What risk is. A project risk is an uncertain event or condition that, if it occurs, may positively or negatively affect project objectives (scope, schedule, cost, quality). Seven processes: plan risk management → identify risks → qualitative analysis → quantitative analysis → plan responses → implement responses → monitor risks — and monitoring never stops. Risk exists at three levels: aggregate (whole-project, judged against the triple constraint), intermediate (categories: market, financial, technology, people, structure/process), disaggregate (individual risks). Risk utility describes appetite: risk-averse, risk-neutral, risk-seeking. Distinguish delivery risk (will the project deliver its objectives?) from delivered/business risk (will the delivered thing create value?). And the crucial pair: a risk has not yet happened (you propose a response); an issue is a current problem (you minimise impact). (Slides 7–11.)
Identifying risks. Four techniques: brainstorming (needs facilitation; groups can underperform individuals), Delphi (anonymous expert rounds toward consensus — powerful where people won't speak openly; used after the ASX CHESS failure, per the presenter), interviewing (the technique the presenter's risk teams use most), SWOT (strengths/opportunities → positive risks; weaknesses/threats → negative). Write risks in "If X… then Y" cause-event-impact form — e.g. "If stakeholders request real-time occupancy features after scope approval, then the project may experience scope creep and delivery delays." Language cues: could / is going to = risk; has happened / is happening = issue; we need this from X = dependency. (Slides 12–13; transcript.)
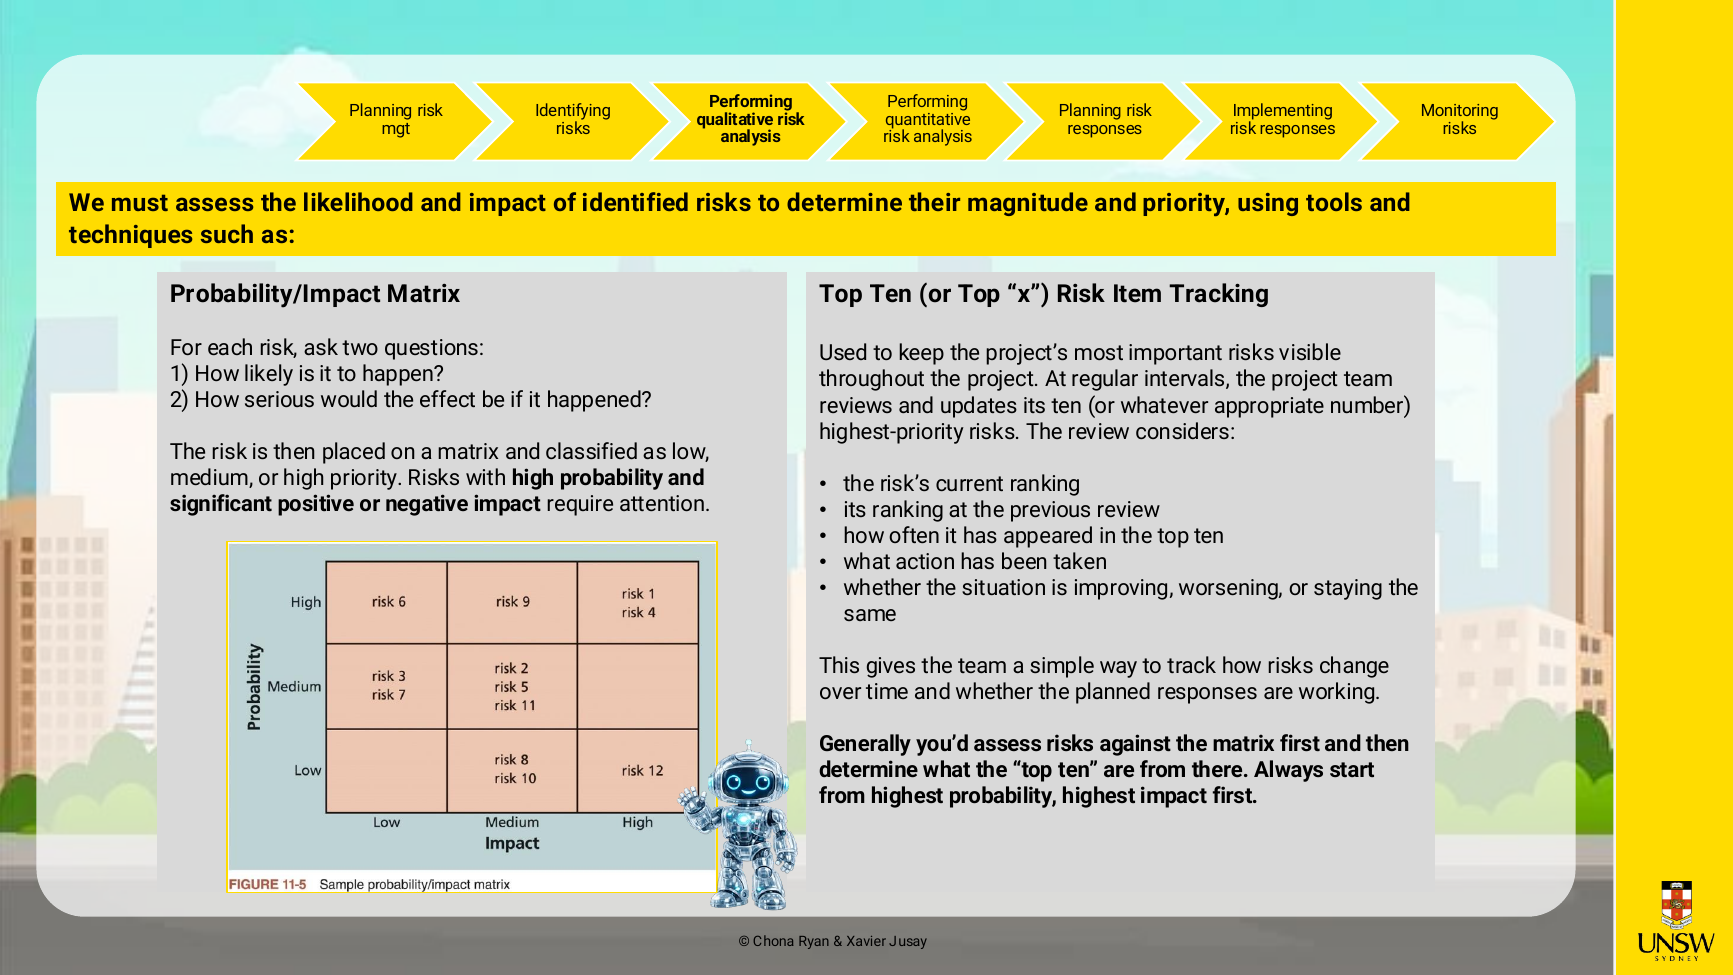
Qualitative analysis. Place each risk on a probability/impact matrix (how likely? how serious?) → low/medium/high priority; then keep the most important visible via Top Ten Risk Item Tracking (current vs previous ranking, times in the top ten, actions, trend). Likelihood scale used in class: Rare 0–10%, Unlikely 10–25%, Possible 25–50%, Likely 50–85%, Almost Certain 85–100%. [Transcript] Exam hint: don't recite definitions — justify why a probability or impact rating is what it is, in the case's terms. (Slides 16–17.)
WEEK8/INFS3703 Wk08 Seminar.pdf, slide 16.Quantitative analysis. Decision trees + EMV (expected monetary value): EMV = Σ (probability × outcome). Worked example — Automated Migration: 0.70×$80,000 + 0.30×$200,000 = $116,000; Manual Migration: 0.90×$110,000 + 0.10×$160,000 = $115,000 → choose the lower expected cost (manual). EMV is a probability-weighted average, not what you'll actually spend. Monte Carlo simulation runs the schedule thousands of times from duration ranges, dependencies, calendars and risk events, yielding deadline probabilities (e.g. 45 days 40%, 56 days 80%). Sensitivity analysis varies one input at a time to find which uncertainty matters most. [Transcript] Industry candour: these are rarely maintained in practice ("by week three, all of this is already outdated") — the durable skill is thinking in probabilities and giving leadership options. (Slides 19–21.)
Responding. Negative-risk strategies: avoid (change the plan — e.g. drop real-time occupancy from release 1), accept (acknowledge; get acceptance signed off), transfer (shift management to a third party — but accountability never transfers), mitigate (cut probability/impact — e.g. early accessibility reviews), escalate (beyond the team's authority — e.g. university-wide privacy policy). Positive-risk strategies: exploit, enhance, share, accept, escalate. Every response leaves residual risk (you never mitigate to zero — re-assess on the matrix) and may create secondary risks (new risks born from the response — add them to the log). (Slides 23–25.)
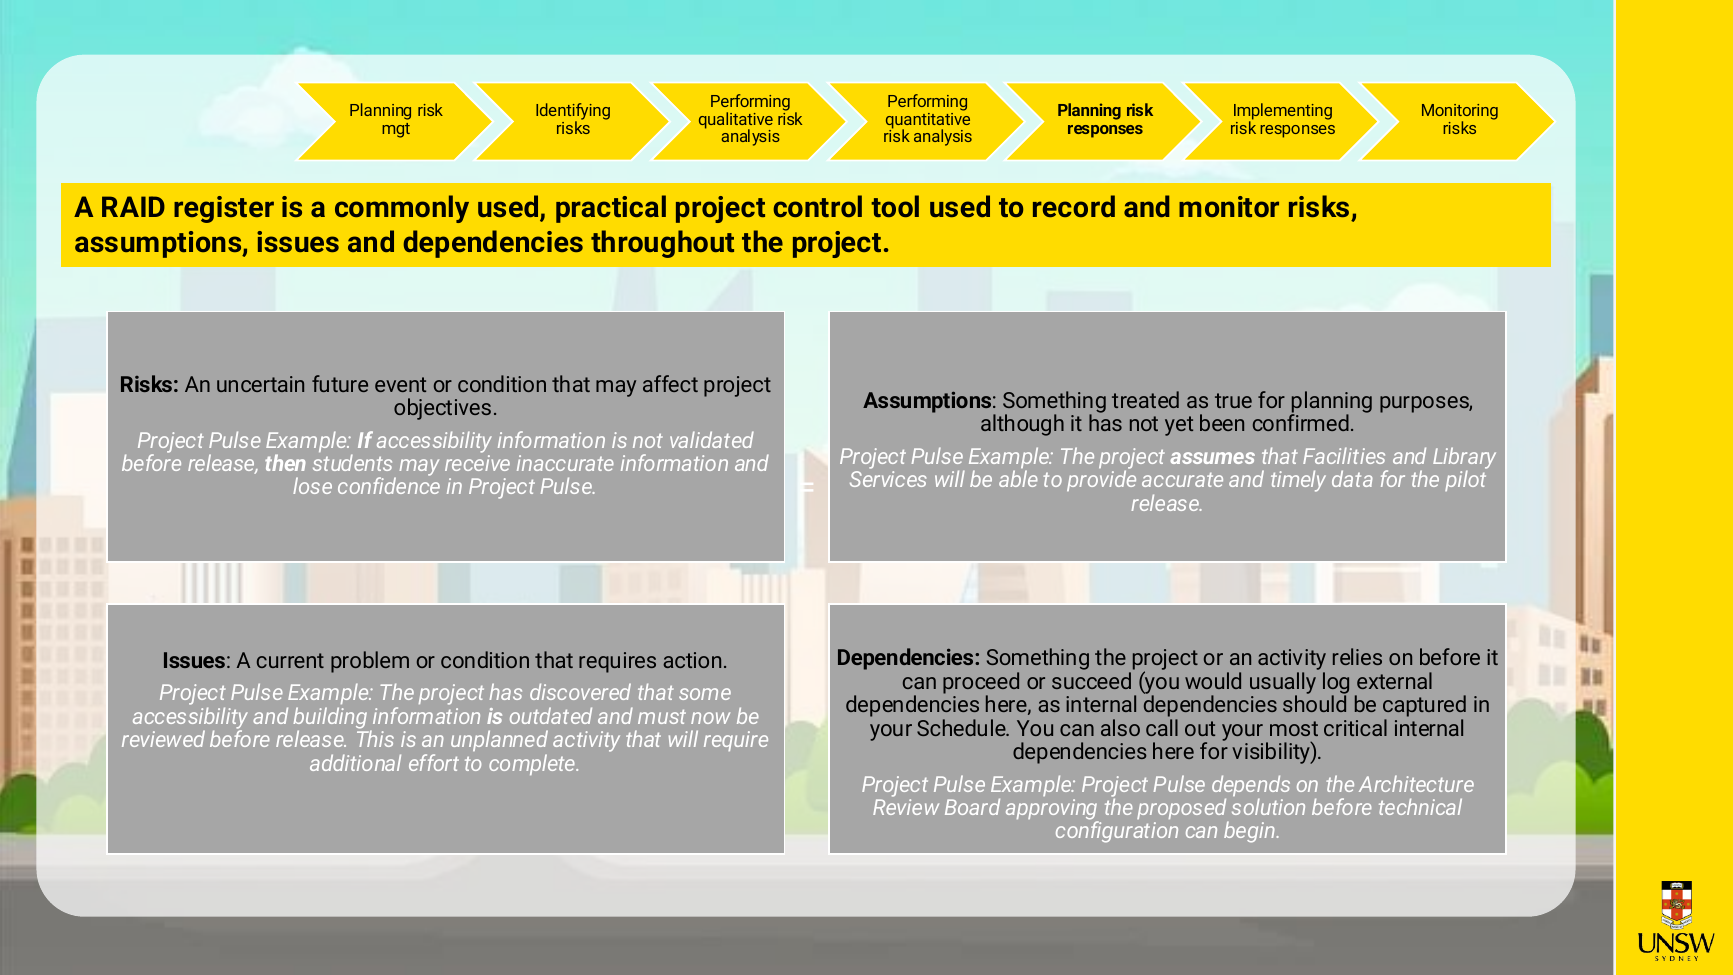
The RAID register. The practical control tool recording Risks (uncertain, future), Assumptions (treated as true but unconfirmed), Issues (current problems needing action), Dependencies (things the project relies on — log external ones here; internal ones live in the schedule). Watch for the "watermelon" report — green outside, red inside: weak reporting cultures let risks stay hidden until they surface as issues; escalate early. (A properly identified risk can still occur — when the uncertain event happens, the risk becomes an issue; late reporting is a separate governance failure.) In Agile, the same purposes run more frequently with lighter documentation (risk board, backlog, impediment log). (Slides 27, 29–30; transcript.)
WEEK8/INFS3703 Wk08 Seminar.pdf, slide 27.Important terminology and frameworks
Project risk; aggregate/intermediate/disaggregate; risk utility (averse/neutral/seeking); delivery vs delivered risk; risk vs issue; contingency plan vs fallback plan; contingency vs management reserves; brainstorming/Delphi/interviewing/SWOT; if-then risk statements; probability/impact matrix; Top Ten tracking; likelihood scale; EMV & decision trees; Monte Carlo; sensitivity analysis; the 5 negative and 5 positive response strategies; residual risk; secondary risk; RAID register (and the course template's 14 columns). (As taught on slides 7–30.)
Examples and visual material
- Per-knowledge-area IT risk table with Project Pulse if-then examples (slide 13).
- EMV decision tree (slide 19), Monte Carlo walkthrough (slide 20), sensitivity example (slide 21 — cost most sensitive to licence fees).
- Residual/secondary table applying all five negative strategies to Project Pulse (slide 25) — e.g. dropping occupancy tracking leaves residual dissatisfaction and creates a secondary adoption risk.
- [Transcript] War stories: ASX CHESS replacement (no fallback plan; Delphi needed because the culture wasn't safe to speak up); staged go-live ramps (500 → 2,500 → 8,000 → 20,000 users) as contingency, rollback as fallback; the "watermelon" report; "I'm not looking for heroes" (key-person risk).
- [Transcript] Slido classification vote: "building access data provided last week cannot be imported without additional formatting work" → an issue (it has already happened); the class split ~50/50.
- Figures 13, 14 above.
Required pre-class preparation
[Official] Using the Week 8 dossier (a single sponsor email from Shona Bryan) and your previous Project Pulse artefacts and dossiers, identify at least 2 Risks, 2 Assumptions, 2 Issues and 2 Dependencies and fill in the Moodle RAID Log template. The sponsor email demands items that connect to your own scope/schedule/cost/quality decisions, probes specific earlier assumptions (pilot sufficiency, data-source reliability, student-testing availability), and asks for "a small number of well-explained items", not a generic list. Reading: Chapter 11 (per Wk07 slide 35). Due 9 pm the night before. (Week 8 Dossier, pp. 1–2; Wk08 Seminar, slide 4.)
Evidence of completed pre-work
Status: Completed.
Final artefact: WEEK8/Project Pulse RAID Log_FINAL_v2.xlsx.
[Student work] Exactly 8 rows — two per category — each citing prior-week artefacts as evidence: R1 "Reviews may take longer or force rework" (probability Medium, impact High; action: book architecture/privacy/security/accessibility reviews at project start, keep rework time after each); R2 "Leadership may expect more than a pilot" (citing the $553,200 baseline, the $80,000–$200,000 campus-wide validation cost versus the $35,000 pilot allowance, and the sponsor's February 2027 deadline); A1 existing platform licence covers the pilot; A2 enough representative students will join testing; I1 some pilot map/accessibility data is already outdated (owner: Facilities); I2 the feedback workflow has no confirmed owner; D1 architecture-review approval before build; D2 data confirmation from Facilities and Library. Probability/impact filled only for the risks, per the template design. The seminar transcript shows the student's group workshopping R1 in class (mitigation: do the reviews before development).
Versions: Project Pulse RAID Log.xlsx (18 Jul 00:05) is the untouched Moodle template (contains only rows marked "Example only") → _FINAL.xlsx (00:14, first real version) → _FINAL_v2.xlsx (00:33, final; the five v2 corrections are documented in the student's own audit notes Week8_RAID_Audit_v2.md and verified present in the cells). A byte-identical copy of FINAL_v2 sits in WEEK9/Week9_Prework_draft/Selected_Artefacts/ (carried forward as a Week 9 artefact), confirming v2 is the version that counts. ⚠ No upload receipt exists, so submission cannot be verified from files alone.
Key points to remember
- Risk = uncertainty with positive or negative impact; write it as "If X… then Y"; risk vs issue vs dependency is a language-cue game ("could" / "has happened" / "we need").
- Seven risk processes; monitoring never stops. When the uncertain event occurs, the risk becomes an issue — late reporting is a separate governance failure (weak reporting cultures let risks stay hidden until they surface as issues: the "watermelon" warning).
- Qualitative = probability × impact matrix + Top Ten; exam answers must justify the ratings.
- Quantitative = EMV (probability-weighted average; pick lowest expected cost), Monte Carlo (deadline probabilities), sensitivity (one input at a time).
- Five negative responses (avoid/accept/transfer/mitigate/escalate) and five positive ones (exploit/enhance/share/accept/escalate); accountability never transfers; get acceptance signed off.
- Every response leaves residual risk and may create secondary risks — new RAID rows.
- RAID = Risks, Assumptions, Issues, Dependencies; external dependencies in RAID, internal in the schedule; sponsors want few, well-explained, decision-linked items.
- [Transcript] For the team presentation: top 3–5 risks with reasons — never a 25-row list.
- Week 9 pre-work was announced here: "Is Project Pulse worth doing?" — 500 words + 2 portfolio artefacts, worth 4%.
Sources used
WEEK8/INFS3703 Wk08 Seminar.pdf(33 content slides; esp. 4, 7–13, 16–17, 19–21, 23–27, 29–31)WEEK8/Week 8 Dossier.pdf(2 pages; sponsor email)WEEK8/sem transcript wk8.txt(seminar transcript, rough ASR)WEEK8/Project Pulse RAID Log.xlsx[template],…_FINAL.xlsx[draft],…_FINAL_v2.xlsx[student final]WEEK8/Week8_RAID_Audit.md,Week8_RAID_Audit_v2.md[student audit notes, not submissions]assessments/INFS3703 CoPC Assessment Guide.pdf
11. Connections across Weeks 1–8
The course is deliberately cumulative — the same slide-8 note from Week 1 ("everything here is interrelated") plays out in both the theory and the Project Pulse portfolio:
- The triple constraint is the spine. Introduced Week 1; frames stakeholder expectations (Week 2's expectations matrix ranks scope/time/cost); prices every scope exclusion (Week 4 required the triple-constraint impact of adding excluded items); drives schedule trade-offs (Week 5: descope, fast-track, add people, or negotiate); is unified into one measurement by EVM (Week 7); and defines aggregate project risk (Week 8: late, over budget, under-delivered).
- The knowledge-area map is the syllabus. Week 1's slide 25 literally assigns each knowledge area to a week — the course then walks the map: people/communication/stakeholders (2), integration-flavoured process groups (3), scope (4), schedule (5), cost + quality (7), risk (8).
- Artefacts feed artefacts. The Week 2 stakeholder register informs the Week 3 business case's stakeholders and risks; the Week 3 charter's scope section seeds the Week 4 scope statement; Week 4's WBS is explicitly extended in Week 5 ("the Week 5 dossier requires you to build upon what you're building this week" — Week 4 transcript); Week 5's schedule and Week 4's scope are re-tested under cost pressure in Week 7 (the dossier's first task is revisit your Week 4 scope); and Week 8's RAID log must cite prior artefacts by design. The Week 9 dossier then asks whether the whole thing is worth doing, using two artefacts as evidence.
- The case teaches one consistent judgement. Across dossiers, the evidence keeps rewarding the same posture: pilot-first, data-honest, privacy-clean, accessibility-first. "Adoption is the business case" (Wk3) → a modest information-based V1 (Wk4) → a controlled pilot deliverable before Feb 2027 (Wk5) → cost weighted toward data quality and assurance (Wk7) → risks centred on reviews, data owners and expectation gaps (Wk8). [Student work reflects this consistently; the dossiers steer it.]
- Reviews as gates. Architecture, privacy, security and accessibility reviews appear first as stakeholders (Wk2), then as charter stage gates (Wk3), then as schedule dependencies that must not be one final step (Wk5), then as process-quality criteria (Wk7), then as RAID risks/dependencies (Wk8).
- Justification is the assessed skill everywhere. The CoPC rubric's top band requires insightful application "with convincing justifications"; the Week 4 transcript makes it explicit ("if you don't justify and reason I can't pass you… 45% of your final exam is all about justification and rationale"); Week 7 repeats it for contingency sizing; Week 8 repeats it for probability/impact ratings.
- Assessment arc. Week 1 sets the rules → Week 3: mock Path B exam + path lock-in + Team Project briefing → Week 4: Path B Exam 1 (Weeks 1–3) → Week 7: Path B Exam 2 (Weeks 4–5) → Week 9: Exam 3 + team report due → Week 10: Exam 4 + presentations.
12. Consolidated glossary
(Definitions as taught in the official materials; source week in brackets.)
| Term | Definition | Week |
|---|---|---|
| Project | Temporary endeavour with a specific objective and specific resources | 1 |
| IS/IT project | Project where most effort is IT-related or IT manages it | 1 |
| Project management | Application of knowledge, skills, tools and techniques to project activities to meet project requirements (PMBOK) | 1 |
| Triple constraint | Scope, time, cost — interacting constraints that must be balanced | 1 |
| Program | Group of related projects managed in a coordinated way (PMBOK 7th ed.) | 1 |
| Portfolio management | Selecting the optimum mix of projects/programs given funding and resources | 1 |
| Knowledge areas (core/facilitating) | Core: scope, schedule, cost, quality; facilitating: HR, communication, risk, procurement, stakeholder; integration spans all | 1 |
| Project success | On time, on budget, wanted functionality (+ satisfaction, objectives met); contentious by perspective | 1 |
| CoPC | Community of Practice Contribution — weekly 25% assessment (prep + participation) | 1 |
| Project Pulse | The Smart Campus Pulse System case used for all individual pre-work | 1 |
| Path A / Path B | Final-exam routes: one end-of-term exam vs four in-term exams | 1 |
| Organisational culture | Shared assumptions, values and behaviours; ten characteristics | 2 |
| PMO | Project management office — single coordination point in centralised IT | 2 |
| Stakeholder register | Living document of everyone involved in/affected by the project | 2 |
| Power/Interest Grid | 2×2: manage closely / keep satisfied / keep informed / monitor | 2 |
| Communication plan | Per-stakeholder: what document, what format, from whom, when | 2 |
| Expectations management matrix | Sponsor's ranked scope/time/cost priorities | 2 |
| Thamhain & Wilemon influence bases | Authority, assignment, budget, promotion, money, penalty, work challenge, expertise, friendship | 2 |
| Process / process groups | Actions toward a result; initiating, planning, executing, monitoring & control, closing | 3 |
| Business case | Pre-initiation document establishing the need for the project | 3 |
| Project charter | Document formally announcing the project (incl. success criteria) | 3 |
| Project Management Plan | Coordinates all planning documents; guides execution and control | 3 |
| Methodology | How things should be done: processes, steps, templates, reviews, standards | 3 |
| Scrum / product backlog / sprint / burndown chart / retrospective | The Agile delivery framework and its artefacts | 3 |
| Hybrid approach | Predictive governance + agile delivery side-by-side | 3 |
| Scope / deliverable | All work to create the project's products; any product produced by the project | 4 |
| Requirement (business/functional/non-functional) | Condition or capability needed by a user; what the org wants / what the system does / how it performs | 4 |
| RTM | Requirements Traceability Matrix — number, name, category, source, status | 4 |
| Project Scope Statement | Project description, deliverables, requirements, acceptance criteria, constraints, assumptions | 4 |
| WBS / decomposition / WBS dictionary | Deliverable-oriented breakdown of total scope; splitting deliverables; per-item detail document | 4 |
| Scope baseline | Scope statement + WBS | 4 |
| Scope validation / scope creep / scope control | Formal sign-off; uncontrolled growth beyond baseline; managing changes via change control | 4 |
| Activity / milestone | WBS element with duration, cost, resources; zero-duration significant event (SMART) | 5 |
| Dependency (mandatory/discretionary/external; FS/SS/FF/SF) | Sequencing constraints by reason and by relationship type | 5 |
| AOA/ADM vs PDM | Arrows-as-activities vs boxes-as-activities network diagrams; PDM preferred | 5 |
| Three-point estimate | Optimistic / most likely / pessimistic | 5 |
| Duration vs effort | Elapsed time incl. waiting vs work-hours required | 5 |
| Gantt chart | Activities against calendar dates with dependencies and milestone diamonds | 5 |
| Critical path / free float / total float | Longest path (earliest finish); slip without delaying successor; slip without delaying finish | 5 |
| Crashing / fast tracking / buffer | Max compression on critical activities; overlapping activities (risky); padding for uncertainty | 5 |
| Cost / cost management | Resource sacrificed to achieve an objective; completing within approved budget | 7 |
| Direct/indirect cost; sunk cost | Tied to products vs supporting; already spent — ignore in decisions | 7 |
| Contingency vs management reserves | Known unknowns (in baseline) vs unknown unknowns (outside) | 7 |
| ROM / budgetary / definitive estimates | −50/+100% (early) / −10/+25% / −5/+10% (late) | 7 |
| Analogous / bottom-up / three-point / parametric | The four cost-estimating techniques | 7 |
| Cost baseline | Time-phased budget for measuring cost performance | 7 |
| PV, AC, EV, CV, SV, CPI, SPI, BAC, EAC, ETC | The Earned Value Management measurement set; EV = the budgeted value of the work actually completed (see Week 7 table) | 7 |
| AgileEVM | EVM adapted to Scrum artifacts (backlog, velocity, releases) | 7 |
| Quality (ISO) | Totality of characteristics bearing on ability to satisfy stated or implied needs | 7 |
| QA vs QC | Assurance (satisfying standards, audits, benchmarking) vs control (acceptance decisions, rework, process adjustments) | 7 |
| Cost of quality | Conformance + nonconformance (prevention, appraisal, internal/external failure) | 7 |
| Unit / integration / system / UAT | The four testing levels | 7 |
| Seven basic quality tools | Fishbone, control chart, checksheet, scatter, histogram, Pareto, flowchart (+ run chart) | 7 |
| Project risk | Uncertain event/condition with positive or negative effect on objectives | 8 |
| Risk utility | Willingness to accept uncertainty: averse / neutral / seeking | 8 |
| Risk vs issue | Not yet happened (respond) vs already happening (minimise impact) | 8 |
| Delphi Technique | Anonymous multi-round expert consensus | 8 |
| Probability/impact matrix; Top Ten tracking | Qualitative rating grid; rolling review of highest risks | 8 |
| EMV | Σ(probability × outcome) — decision-tree comparison value | 8 |
| Monte Carlo simulation | Thousands of simulated runs → deadline/cost probabilities | 8 |
| Sensitivity analysis | Vary one input at a time to find the dominant uncertainty | 8 |
| Negative responses: avoid/accept/transfer/mitigate/escalate | The five threat strategies (accountability never transfers) | 8 |
| Positive responses: exploit/enhance/share/accept/escalate | The five opportunity strategies | 8 |
| Residual / secondary risk | Risk remaining after response; new risk created by the response | 8 |
| RAID register | Risks, Assumptions, Issues, Dependencies control log | 8 |
13. Consolidated frameworks, models, formulas, diagrams and methods
Frameworks & models - Triple constraint (Wk1, Fig. 1-1) — recurs every week - PM framework / 10 knowledge areas (Wk1, Fig. 1-2) — the course map - Projects–Programs–Portfolios hierarchy; Venture/Growth/Core portfolio categories (Wk1, Fig. 1-4) - Nine project-success factors; six PM traits (Wk1) - Four organisational perspectives; Ten Characteristics of Organisational Culture; functional/project/matrix structures (Wk2, Fig. 2-3) - Thamhain & Wilemon's nine influence bases (Wk2) - Five areas of communication & stakeholder management; Power/Interest Grid; expectations management matrix (Wk2) - Five process groups (Wk3); Figure 3-1 "Alpha PM" time allocation (Wk3) - Business case template (8-item slide version vs 6-item dossier version) and project charter template (Wk3) - Scrum framework (Fig. 2-5); process-groups-to-Agile mapping; hybrid delivery model (Wk3) - Six scope processes; requirement categories (B/F/NFR); five WBS approaches; WBS design rules; scope-creep controls (Wk4) - Seven schedule processes; dependency taxonomy (mandatory/discretionary/external × FS/SS/FF/SF); AOA drawing method; SMART milestones; critical-path method with crashing/fast-tracking/buffers (Wk5) - Four cost processes; estimate-type table (ROM/budgetary/definitive); four estimating techniques; cost-of-quality framework; three quality processes; six IT quality dimensions; four testing levels; seven basic quality tools (Wk7) - Seven risk processes; risk abstraction levels; risk-utility curves; four identification techniques; if-then risk statements; likelihood scale; probability/impact matrix; Top Ten tracking; 5+5 response strategies; residual/secondary analysis; RAID register (Wk8)
Formulas - EV (Earned Value) = the budgeted value of the work actually completed; in the Week 7 slide's simplified single-budget example, EV = BAC × actual percentage complete = $10,000 × 40% = $4,000 (the slide's "PV × % complete" label is inconsistent — see the Week 7 note) - CV = EV − AC SV = EV − PV - CPI = EV ÷ AC SPI = EV ÷ PV - EAC = BAC ÷ CPI (a forecast that assumes the current cost performance continues for the remaining work) ETC = EAC − AC - EMV = Σ (probability × monetary outcome) - Duration via NETWORKDAYS (course Gantt template, excludes weekends) - Contingency bands from case data: 10–15% (low uncertainty), 15–25% (moderate), 25–40% (high)
Diagrams to recognise on sight - Triple-constraint triangle (Fig. 1-1); PM framework (Fig. 1-2); portfolio categories (Fig. 1-4) - Org structures (Fig. 2-3); Power/Interest Grid - Scrum loop (Fig. 2-5); process-group time chart (Fig. 3-1) - WBS hierarchy; Gantt chart with milestone diamonds (Fig. 6-6); AOA vs PDM network diagrams; task-dependency types (Fig. 6-3) - Earned-value chart (Fig. 7-6: EV below AC/PV = trouble) - The seven quality tools (Figs. 8-2 → 8-7); utility curves (Fig. 11-2); probability/impact matrix (Fig. 11-5); decision tree; RAID quadrant
Methods practised hands-on (in pre-work or seminar) - Building a stakeholder register, power-interest matrix, communication plan (Wk2) - Options analysis and methodology justification; writing a charter with measurable success criteria (Wk3) - Writing B/F/NFR requirements; building a 3-level WBS three ways; RTM construction (Wk4) - Activity listing with dependency types; drawing a PDM network; building a Gantt + 5-milestone sponsor schedule from a template (Wk5) - Filling a structured cost-estimate workbook from indicative ranges; defining process vs deliverable quality criteria (Wk7) - Populating a RAID log tied to earlier artefacts; refining responses with residual/secondary risks (Wk8)
14. Pre-work completion summary table
| Week | Required preparation (official) | Evidence found in folder | Completion status | Main output file or artefact |
|---|---|---|---|---|
| 1 | None (CoPC runs Wks 2–5, 7–9); reading Ch 1 | Seminar deck only | No pre-work requirement identified | — |
| 2 | Stakeholder Register from 10-doc dossier (6 minimum fields) | 14-row register + judgements + P/I grid + comms table (2-page Class-Notebook export; v5 HTML draft) | Completed | WEEK2/final Week 2 pre-work Stakeholder Register for Project Pulse.pdf |
| 3 | Draft business case (6 sections) + proposed methodology | Full business case with 3-option analysis and hybrid methodology; charter from in-class activity also present | Completed | WEEK3/Week3_CoPC_Prework_table_colored.html (+ Loop paragraph.pdf charter) |
| 4 | In-scope/out-of-scope decision for Project Pulse V1 from 11-doc dossier | 6-section submission (scope tables, scope statement, mini WBS) + richer 11-section working version with RTM | Completed | WEEK4/final pre work提交.docx (= Week 4 Dossier vfinal.pdf) |
| 5 | WBS + activity list (no estimates) + network diagram based on own Wk4 scope | All three items present (11 work packages, A01–A16, PDM diagram); in-class Gantt went to Teams, not this folder | Completed | WEEK5/Wk 5 Prep work final.pdf |
| 6 | None — Flex Week | None (by design) | No pre-work requirement identified | — |
| 7 | Scope revisit + high-level cost estimate (Excel template) + process & deliverable quality definitions | All three tasks; 22-line estimate ($461k + 20% → $553,200 baseline) + quality tables | Completed | WEEK7/Week 7 CoPC Artefact最终提交.docx + High Level Cost Estimate Template_FINAL.xlsx |
| 8 | RAID log: ≥2 risks, 2 assumptions, 2 issues, 2 dependencies in Moodle template | 8 rows (2 per category), each evidenced from Weeks 2–7 artefacts; v1→v2 chain documented | Completed | WEEK8/Project Pulse RAID Log_FINAL_v2.xlsx |
Caveat applying to all "Completed" rows: the folder contains the completed artefacts, but no Moodle/Class-Notebook upload receipts — actual submission and deadline compliance cannot be verified from files alone.
15. Source map (summary)
Full claim-level table: Course_Weeks_1-8_Source_Map.md. In brief, the guide rests on:
- Official assessment guides (authority 1):
assessments/INFS3703 CoPC Assessment Guide.pdf;assessments/INFS3703 Team Project Assessment Guide.pdf(+ byte-identical copy ingroup/);assessments/Team Project Cover Page.pptx. - Official dossiers (authority 2): Week 2 (11 pp), Week 3 (two versions, identical text), Week 4 (12 pp incl. 3 audio docs), Week 5 (9 pp), Week 7 (8 pp + costing Excel + estimate template), Week 8 (2 pp), plus Week 9's dossier used only to corroborate the portfolio arc.
- Official seminar decks (authority 3): Wk01 (33 slides), Wk02 (28), Wk03 (27), Wk04 (25), Wk05 (25), Wk07 (37), Wk08 (33); Wk09 deck used only for its roadmap slide.
- Transcripts (authority 4): Week 4 seminar, Week 5 seminar, Week 7 seminar, Week 8 seminar; case-audio transcripts (Wk4 Docs 3/5/6; Wk5 Doc 4). All rough ASR.
- Student finals (authority 5): Wk2 register PDF; Wk3 colored-table HTML + Loop charter; Wk4 提交 docx; Wk5 Prep work final PDF; Wk7 最终提交 docx/xlsx; Wk8 RAID FINAL_v2 xlsx.
- Student drafts (authority 6): the version chains listed per week.
- Informal notes (authority 7 — used only as leads, never as fact): root revision packs/dashboards, Week 7 talking points, Week 8 RAID audits, Week 9 revision suite.
- Ignored as derived/duplicate:
.codex-temp/,tmp/(page renders of documents that exist elsewhere), audio files where transcripts exist (新录音 79/83.m4a,.wav,.mp3), CN translations of revision packs.
16. Unresolved gaps or contradictions
Contradictions found between sources (with resolution applied):
- Submission channel. CoPC Guide (official, p. 1/3): upload to Teams Class Notebook. Week 4 + Week 5 transcripts: moved to Moodle, draft-status step removed, 9 pm deadline kept. → Reported both; the guide predates the change and was not updated.
- EV formula wording (official deck defect, verified). Wk07 slides label the formula "EV = PV × % complete" but the worked scenario computes EV = 40% × BAC ($10,000) while PV at that date is $5,000. → The worked example is internally consistent when EV is read as the budgeted value of the work actually completed: in this simplified single-budget example, EV = BAC × actual percentage complete = $10,000 × 40% = $4,000, and every downstream number on the slide follows from it. (This simplification works because the example treats the whole project as one budgeted unit.)
- Business case contents. Wk03 slide 8 lists 8 components; the Week 3 dossier's pre-work list has 6 (drops initial estimates and preliminary risk analysis; folds methodology into Options). → Both reported; the dossier governs the pre-work.
- Week 5 reading. Wk05 slide 3 says "Chapter 5"; the Week 5 dossier (filename and p. 1) says Chapter 6. → Dossier treated as correct (schedule management = Ch 6); slide likely a typo.
- Team-project mark split. Wk01 slide 10: "recovery plan (worth 15%)" + Q&A 15%. Assessment guide: 7.5% content + 7.5% presentation + 15% Q&A. → Assessment guide (higher authority) adopted.
- Week 7 exam duration. Wk07 agenda slide: "First 45 minutes: Path B Exam (15%)". Student prep pack: "first 30 minutes". → Official slide reported; student figure noted as low-authority.
- "Week 4 Dossier vfinal.pdf" filename. Not a dossier at all — it is the student's condensed pre-work. → Corrected throughout this guide.
- Week 3 dossier duplicates / Week 5 BASIC duplicates. Two Week 3 dossier PDFs are word-for-word identical (one adds official headers/footers);
Week5 …BASIC_full_with_notes.htmlis byte-identical to…BASIC.htmldespite its name. → Treated as single sources, not separate works.
Gaps (no evidence available in the folder):
- No seminar transcripts or recordings exist for Weeks 1, 2, 3 — spoken guidance for those weeks (incl. the mock-exam debrief and Team Project briefing) cannot be recovered.
- No upload receipts exist for any week's pre-work — "Completed" statuses rest on the artefacts themselves, not proof of submission.
- The in-class Week 5 Gantt chart is absent (submitted to a Teams channel per the transcript);
Project Pulse Gantt Chart.xlsxis judged the unmodified template ⚠ (its last-modified time post-dates the seminar, so a student save cannot be fully excluded). - No Final Exam assessment guide exists in the folder; Path B exam durations (25 min + 5 min reading) rest on Week 1 slide 10 plus low-authority student notes; exact per-exam topic scopes for Exams 1–2 rest on the Week 4 transcript ("next exam is weeks four and five, assuming you already know one, two and three") and student packs. ⚠
- What students were expected to do in Flex Week (Week 6) is nowhere stated.
- Which OneNote/Moodle file was the actual uploaded submission in Weeks 2–5 and 7–8 cannot be pinned down where multiple near-identical finals exist.
- The Week 4 "Maya Call" audio transcript degrades into garbled text in its final third; the Week 5/7/8 seminar transcripts are heavily garbled ASR — quotes from them are approximate.
- The exact Week 9 CoPC 4% split (2% prep / 2% participation appears on Wk08 slide 31) is not in the CoPC guide, which never details the Week 9 deliverable.
Guide generated on 26 July 2026 from the INFS3703 course folder. Original course files were not modified. All images in assets/course_guide/ are excerpts from the official course PDFs cited in their captions, reproduced here for personal study only (course materials are © Chona Ryan & Xavier Jusay / © Xavier Jusay per their footers).